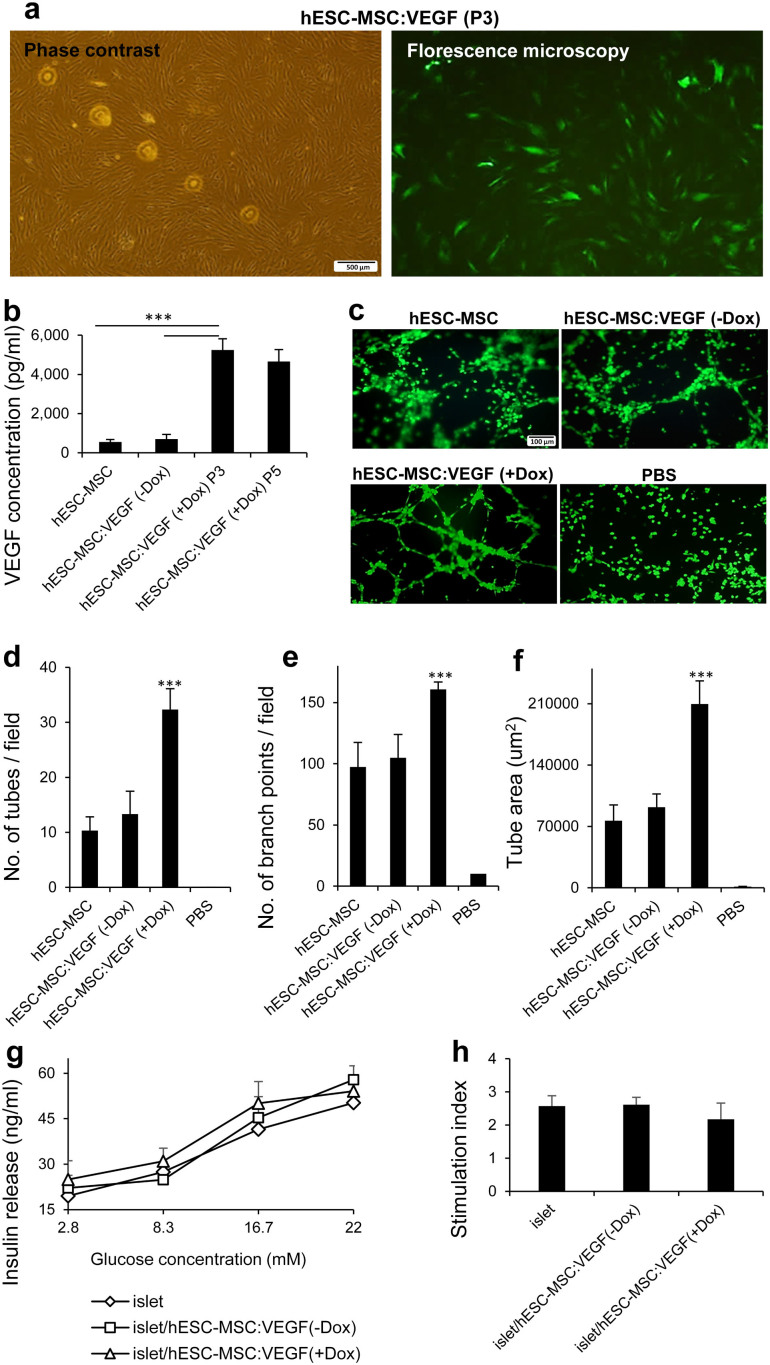
Figure 2. Lentiviral transduction of hESC-MSCs for inducible expression of VEGF.
(a) Phase contrast (left) and fluorescent (right) images of double transduced hESC-MSCs at passage 3. (b) VEGF ELISA for transduced hESC-MSCs (hESC-MSC:VEGF) in +Dox (passages 3 and 5) or -Dox. (c) Tube formation assay (HUVECs stained by Calcein AM) and quantification by Image J, calculating the numbers of tubes (d) branch points (e) and tube area per field (f); five fields per sample, n = 3. (g) Glucose stimulated insulin secretion in 2.8, 8.3, 16.7 and 22 mM glucose and (h) Stimulation index (ratio of highly stimulated over basal insulin secretion) of islets co-cultured with hESC-MSC:VEGF. Values represent mean ± SD, ***p < 0.005. Dox: Doxycycline.

