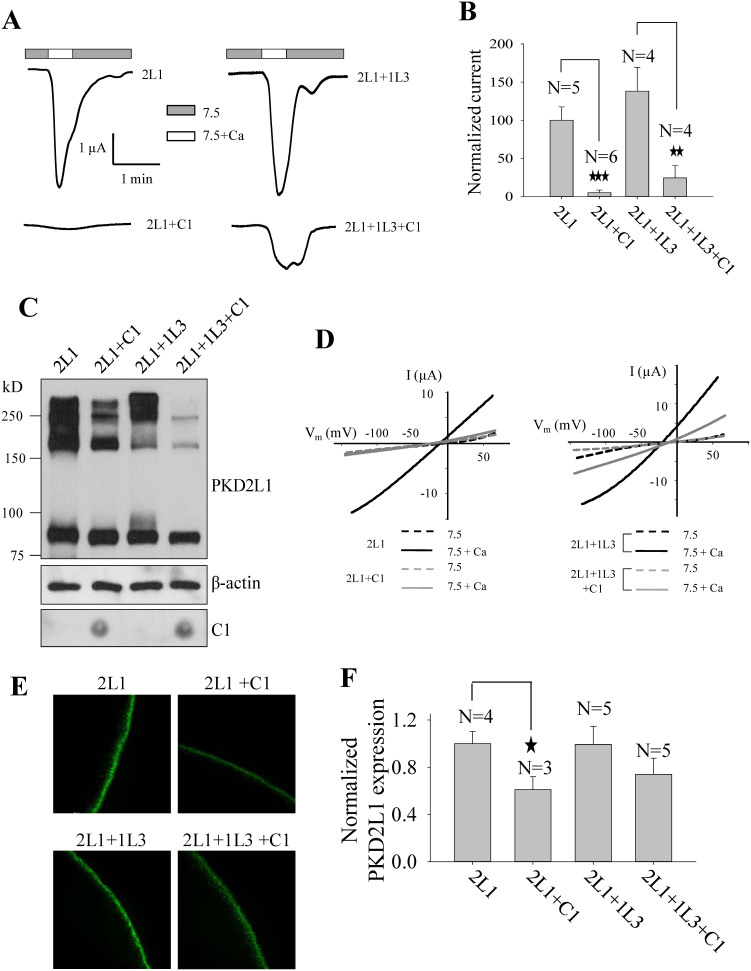
Figure 6. Effect of C1 on PKD2L1 trimerization and function.
(A) Representative whole-cell current tracings from Xenopus oocytes expressing PKD2L1 (2L1) or PKD2L1/PKD1L3 (2L1+1L3), with or without C1 using the two-microelectrode voltage clamp technique under similar conditions as for Fig. 2. (B) Averaged currents elicited by extracellular 5 mM Ca2+ from oocytes expressing 2L1 or 2L1+1L3, with or without C1, and voltage clamped at −50 mV. Currents were averaged from different numbers of oocytes, as indicated, and normalized to that of WT PKD2L1 alone. (C) WB detection of PKD2L1 expression or dot blot detection of C1 expression in oocytes. (D) Representative current–voltage relationship curves obtained using a voltage ramp protocol, as indicated in Fig. 2C, before (7.5) and after (7.5+Ca) addition of 5 mM CaCl2. (E) Representative immunofluorescence data showing the oocyte plasma membrane expression of 2L1 and 2L1+1L3, with or without C1. (F) Surface expression was quantified and averaged from the indicated numbers of oocytes, and normalized to that of 2L1.

