
Figure 2. Forest plots of the sensitivity and specificity for calretinin in the diagnosis of malignant mesothelioma for all studies.
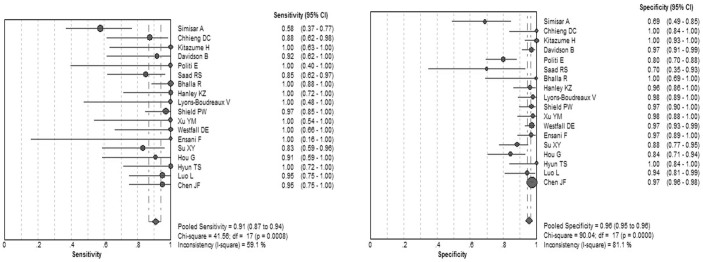
The point estimates of sensitivity and specificity for each study are shown as solid circles and the size of each solid circle indicates the sample size of each study. Error bars are 95% confidence intervals.