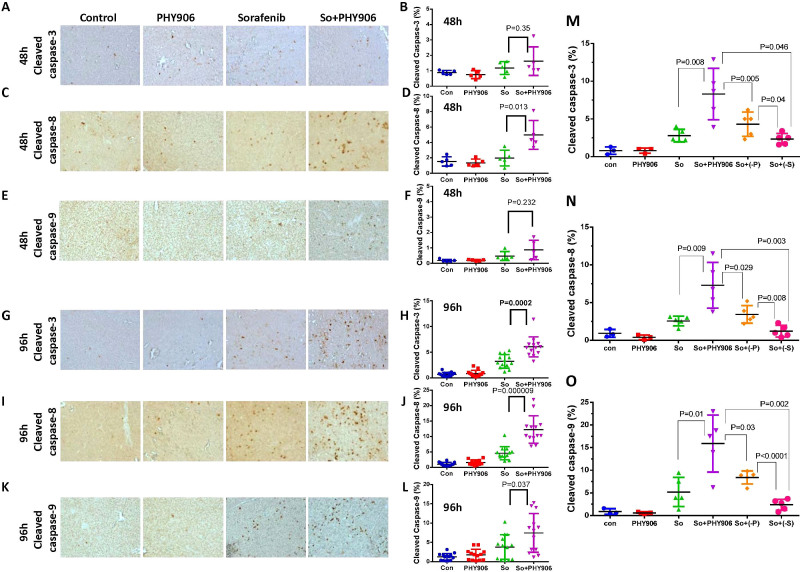
Figure 2. Effect of PHY906, Sorafenib (So), Sorafenib+PHY906 (So+PHY906), Sorafenib+PHY906 deleted P (So+(-P)) and Sorafenib+PHY906 deleted S (So+(-S)) on the induction of apoptosis and growth of HepG2 tumors in NCR nude mice.
Immunohistochemistry staining for cleaved caspase-3 (A, G), cleaved caspase-8(C, I), cleaved caspase-9 (E, K) of HepG2 tumor section after treatment with Sorafenib and So+PHY906 for 48 h and 96 h. Percentage of cleaved caspase-3(B, H, M), cleaved caspase-8(D, J, N), cleaved caspase-9 (F, L, O) stained cell per each view of HepG2 tumor section after the drug treatment for 48 h and 96 h. Each spot represents a mean of the number of heavily stained cells from 4 to 5 views of each tumor section against total live cells (PCNA-stained) in each treatment group. Number of animals are 5 to 9. Sorafenib (30 mg/kg, b.i.d.) and/or PHY906, (-P), (-S) (500 mg/kg, b.i.d.) were administered orally twice a day. Details of experimental procedures are given in Materials and Methods.

