
Figure 5. Western blot analysis confirmed changes in protein expression initially identified by quantitative proteomics method.
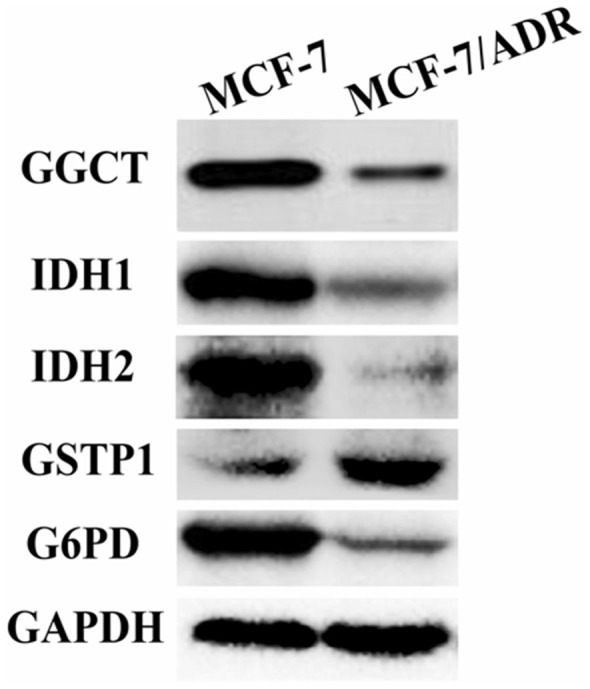
The expression of DEPs was focused on GSH metabolism pathway. G6PD, GGCT, IDH1 and IDH2 were found down–regulated in MCF-7/ADR cells compared with MCF-7 cells. Up-regulated expression was observed for GSTP1. GAPDH was used as the loading control.