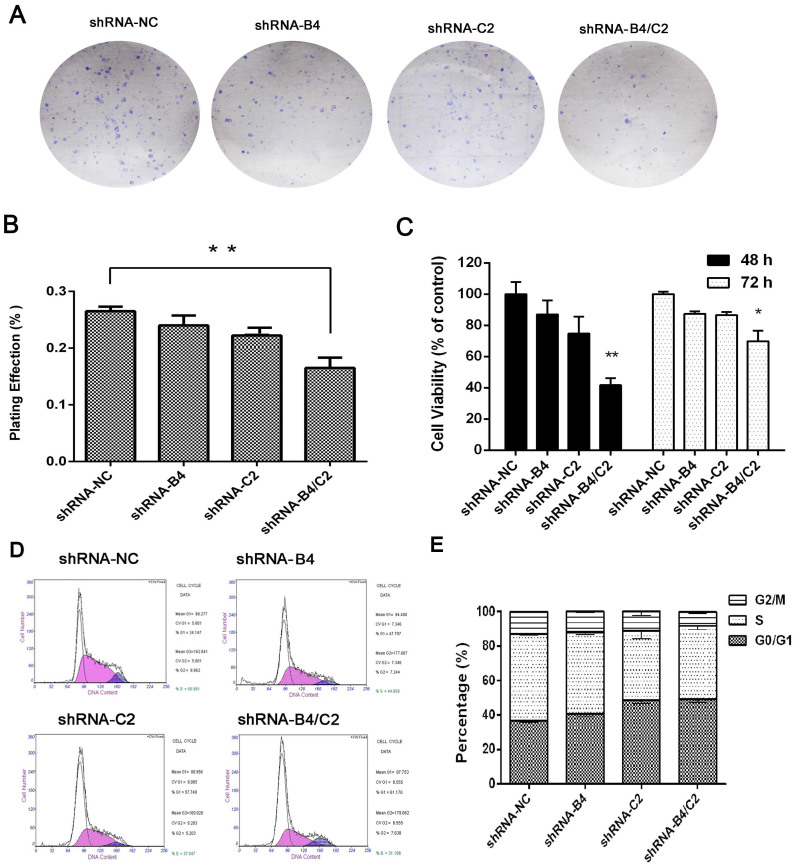
Figure 3. knock-down of ubiquitin affected the proliferation of H1299 cells.
(A) Representative colony images. (B) Calculated relative colony formation rate. (C) The effect of ubiquitin silencing on cell viability of H1299 cells by using MTT assay and the shRNA-NC-transfected cells were normalized as 100%. (D) Representative charts for cell cycle distribution in ubiquitin knock-down and the control cells. (E) Calculated cell cycle distribution of in ubiquitin knock-down and the control cells. Data are expressed as means ± SEM from 3 separate experiments. * P < 0.05, **P < 0.01, compared with shRNA-NC group.

