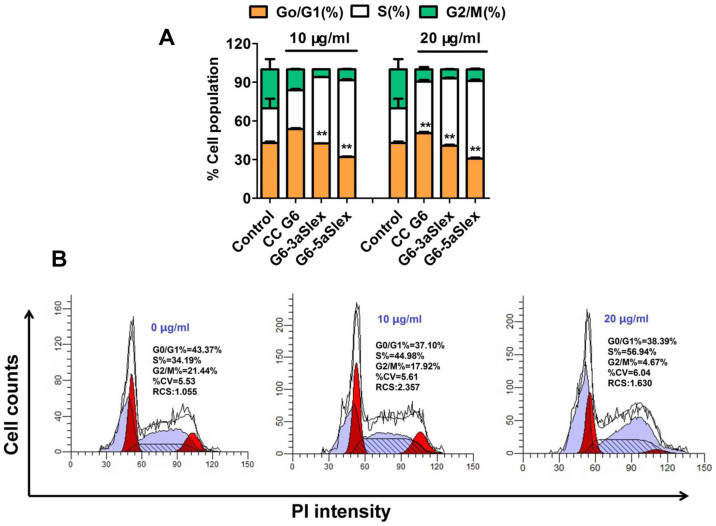
Figure 7. Effects of CC G6 and G6-aSlex conjugates on the cell cycle distribution.
(A), Percentage of cell population in every stage (G0/G1, S, G2/M). (B), PI staining showed the cell cycle distribution induced by different concentrations of G6-5aSlex conjugate (0, 10, 20 μg/ml). In comparison with control, an obvious increase of cell population in S phase and a decrease of that in G2/M phase were found in the treated group.

