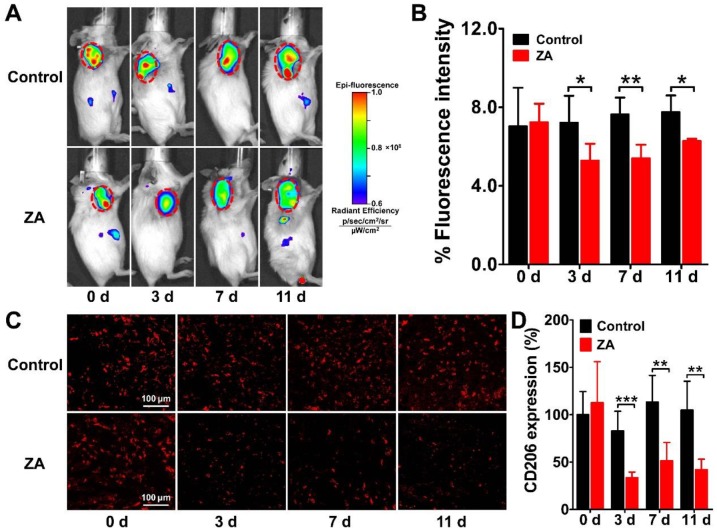
Figure 4.
Longitudinal in vivo NIRF images (A) and quantified tumor uptake (B) of 4T1 tumor-bearing mice at 24 h after Dye-anti-CD206 injection on days 0, 3, 7, and 11 after zoledronic acid (ZA; 150 μg/kg in PBS daily for 7 days) or PBS treatment (control). Tumors are indicated by the dashed circles. (C-D) Immunofluorescence staining (C) and quantified integrated optical density (IOD) expressed in relative percentages (D) of murine CD206 in 4T1 tumor tissues on days 0, 3, 7, and 11 after ZA or PBS treatment. *, P <0.05; **, P <0.01; ***, P <0.001.

