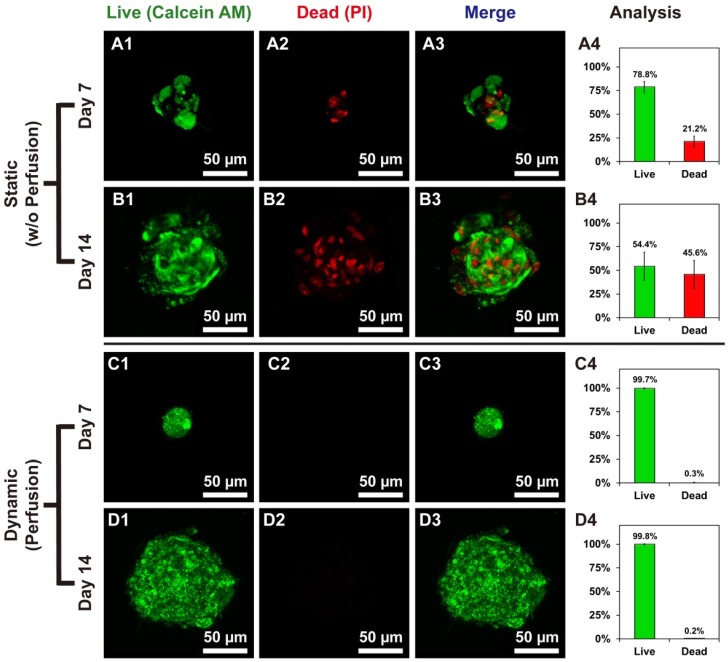
Figure 4.
Live/dead staining showed the difference between hOBs @Ca-Alginate scaffolds w/ and w/o perfusion. (A1, B1, C1, and D1) in green represented the live cells of bone-like tissues with calcein AM dye; (A2, B2, C2, and D2) in red (PI) indicated dead cells; (A3, B3, C3, and D3) were the merge images; (A4, B4, C4, and D4) displayed the percentage of live and dead cells.

