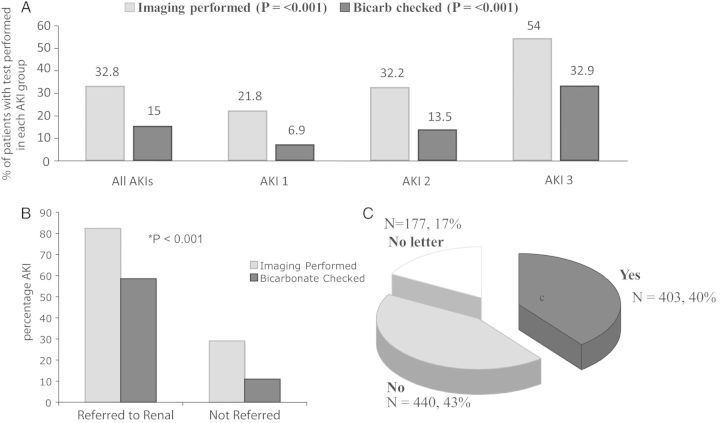
Fig. 2.
(A) Demonstrates percentages of patients that had renal imaging and acid–base status analysis for all patients with AKI, dividing according to AKI stage. NCEPOD compliance increased with increasing AKI severity for both investigative parameters (Pearson’s χ2 test, P < 0.001). (B) Demonstrates percentages of patients that had renal imaging and acid–base status assessment divided according to whether they were referred or not to nephrology services. Renal referral was associated with improved NCEPOD compliance across both investigative parameters (Fisher's exact test, P < 0.001). (C) Demonstrates percentages of patients that had AKI documented as part of their in-patient admission on their discharge documentation to the GP.

