
FIGURE 2. Tumor cell response to chemotherapy leads to increased shedding and synthesis of syndecan-1 that is dependent on caspase activation.
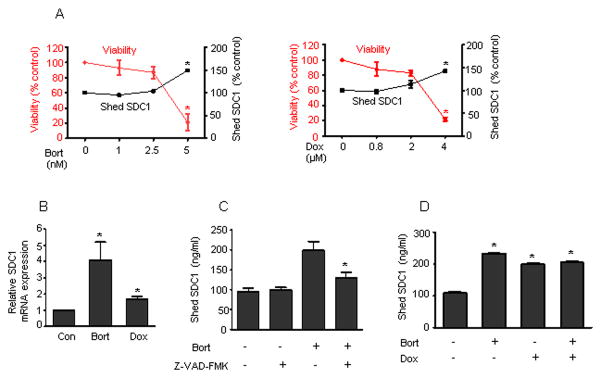
(A) MM1.S cells were plated at a density of 5 X 10⁵ cells/ml in serum free medium for 16 h with different concentrations of bortezomib (1, 2.5, 5 nM) or doxorubicin (0.8, 2, 4 uM). Cell viability was assessed by MTT assay and the level of shed syndecan-1 was determined. Untreated MM1.S cells served as the control. The experiments were performed in quadruplicate and the data presented are mean ± S.E. of three independent experiments. *, p < 0.005 versus untreated controls. (B) MM1.S cells were seeded in serum free medium for 8 h in the presence of bortezomib (5 nM) or doxorubicin (4 uM). SDC1 mRNA transcript from each sample was determined by real time PCR and normalized against a standard housekeeping gene (18S rRNA). Syndecan-1 transcript levels in untreated cells served as the control. Data are mean ± SE of three independent experiments. *p < 0.01 versus untreated control. (C) 5 X 10⁵ MM1.S cells were seeded in serum free medium for 6 h in the presence of DMSO or caspase inhibitor Z-VAD-FMK (1 uM). At the end of incubation, bortezomib (100 nM) was added and incubated for 16 h. The level of shed syndecan-1 in the conditioned medium was then determined. Data are mean ± S.E. of three independent experiments. *, p < 0.05 versus bortezomib treated cells. (D) MM1.S cells were seeded in serum free medium for 4 h and then bortezomib (100 nM) and/or doxorubicin (8 uM) were added and further incubated for 16h. The level of shed syndecan-1 in the conditioned medium was determined. Untreated cells served as the control. Data are mean ± S.E. of three independent experiments. *, p < 0.01 versus untreated control.