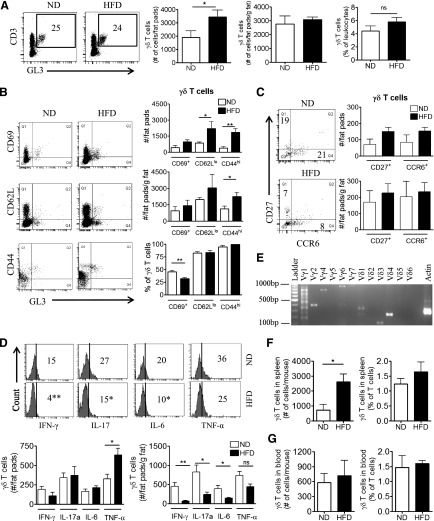
Figure 1. Characterization of γδ T cells in eAT of mice after 5 weeks of HFD.
(A) Analysis of CD3+GL3+ γδ T cells in SVF isolated by collagenase digestion of eAT from male C57BL/6J mice on 5 weeks of ND (white bars) or HFD (black bars). Cells were gated on the CD3+ population and analyzed for coexpression of GL3 by flow cytometry. Data are represented as total number of γδ T cells in eAT/mouse (# of cells/fat pads) and number of cells relative to grams of AT mass (# of cells/fat pads/g fat) and as percentage of total leukocytes in eAT, and numbers inside boxes refer to percentage of γδ T cells of total T cells; n = 8–10 mice in each group. *P < 0.05, ns, Not significant. (B) Flow cytometric analysis of CD69, CD62L and CD44 expression on γδ T cells in eAT of mice after 5 weeks of ND or HFD. (C) Flow cytometric analysis of CD27 and CCR6 expression on γδ T cells in eAT of mice after 5 weeks of ND or HFD. (D) Flow cytometric analysis of intracellular cytokine IFN-γ, IL-17, IL-6, and TNF-α expression by γδ T cells in eAT after 5 weeks of ND or HFD. SVF cells were isolated from eAT and cultured overnight in DMEM containing Brefeldin A. (B–D) Data are represented as number of cells/fats pads and number of cells/fat pads/gram of fat and as a percentage of γδ T cells in eAT (numbers inside box). *P < 0.05, and **P < 0.01 comparing ND- and HFD-fed groups of mice; n = 4–5 mice in each group. (E) PCR analysis to determine the γ and δ TCR chains expressed in eAT of C57BL/6J mice after 5 weeks of HFD. Representative gel picture of at least 3 repeat experiments. (F and G) Flow cytometric analysis of γδ T cells in (F) spleen and (G) whole blood after 5 weeks of ND or HFD, represented as number of cells/tissue and as a percent of total T cells; n = 3–5 mice in each group. Values are mean ± sem. *P < 0.05 by Student’s t-test.

