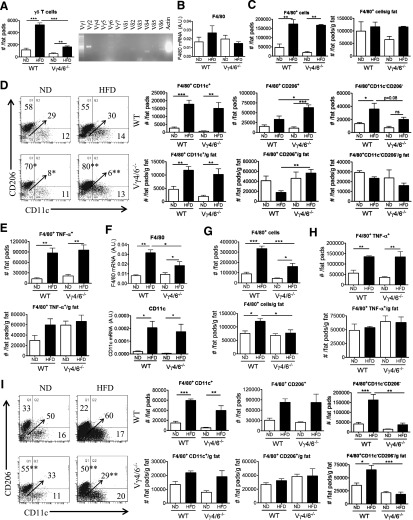
Figure 6. HFD-fed Vγ4/6−/− mice have increased CD206+ M2 macrophages in eAT.
(A) Quantification of γδ T cells in eAT of Vγ4/6−/− and WT mice after 5 weeks of ND or HFD by flow cytometry analysis (n = 4–5 mice in each group; data from a representative experiment of 3 independent experiments) and PCR analysis to determine the γ and δ TCR chains expressed in eAT of Vγ4/6−/− mice after 5 weeks of HFD (representative gel picture of at least 3 repeat experiments). (B) mRNA expression of F4/80 in eAT of Vγ4/6−/− and WT mice after 5 weeks of ND or HFD, as determined by qPCR; n = 4–6 mice in each group. (C–E) Flow cytometric analysis of SVF cells in eAT of Vγ4/6−/− and WT mice after 5 weeks of ND or HFD. (C) Total F4/80+ macrophages, (D) F4/80+CD11c+CD206– M1, F4/80+CD11c–CD206+ M2, and F4/80+CD11c–CD206– DN macrophages, and (E) TNF-α+ macrophages; n = 4–5 mice in each group. Data from a representative experiment of 3 independent experiments. (F) mRNA expression of F4/80 and CD11c in eAT of Vγ4/6−/− and WT mice after 10 weeks of ND or HFD, as determined by qPCR; n = 4–6 mice in each group. (G–I) Flow cytometric analysis of SVF cells in eAT of Vγ4/6−/− and WT mice after 10 weeks of ND or HFD. (G) Total F4/80+ macrophages, (H) TNF-α+ macrophages, and (I) F4/80+CD11c+CD206– M1, F4/80+CD11c–CD206+ M2, and F4/80+CD11c–CD206– DN macrophages; n = 4–5 mice in each group. Data from a representative experiment of 2 independent experiments. Data are represented as number of cells/fat pads and number of cells/fat pads/gram of fat and as a percentage of macrophages. Values are mean ± sem. *P < 0.05, **P < 0.01, and ***P < 0.001 by one-way ANOVA with Tukey’s post hoc test. Numbers inside boxes refer to percent of cells, arrow points to value of double negative quadrant, and *P < 0.05, and **P < 0.01 comparing WT and Vγ4/6−/− mice on the same diet.

