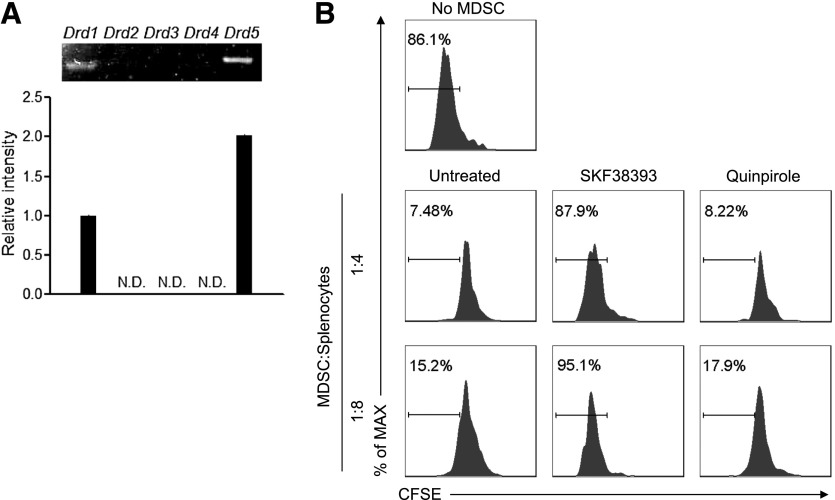
Figure 3. DA inhibits Gr-1+CD115+ MDSC function through D1-like DA receptors.
(A) RT-PCR analysis of the expression of DA receptor genes in Gr-1+CD115+ MDSCs isolated from tumor-bearing mice. The intensity of the band of DA receptor 1 (Drd1) was defined as 1. N.D., Not detected. (B) Flow cytometry of CFSE dilution in CD3+ T cells in naive splenocytes stimulated with anti-CD3 and anti-CD28 and cultured for 4 days alone or with CD115+ splenic MDSCs purified from mice with large tumor burdens and untreated or pretreated for 4 h with 50 µM SKF38393 or Quinpirole. Numbers indicate the percentage of CFSElow T cells in total CD3+ T cells. Representative data from 3 independent experiments, yielding similar results, are shown. Error bars indicate sem.

