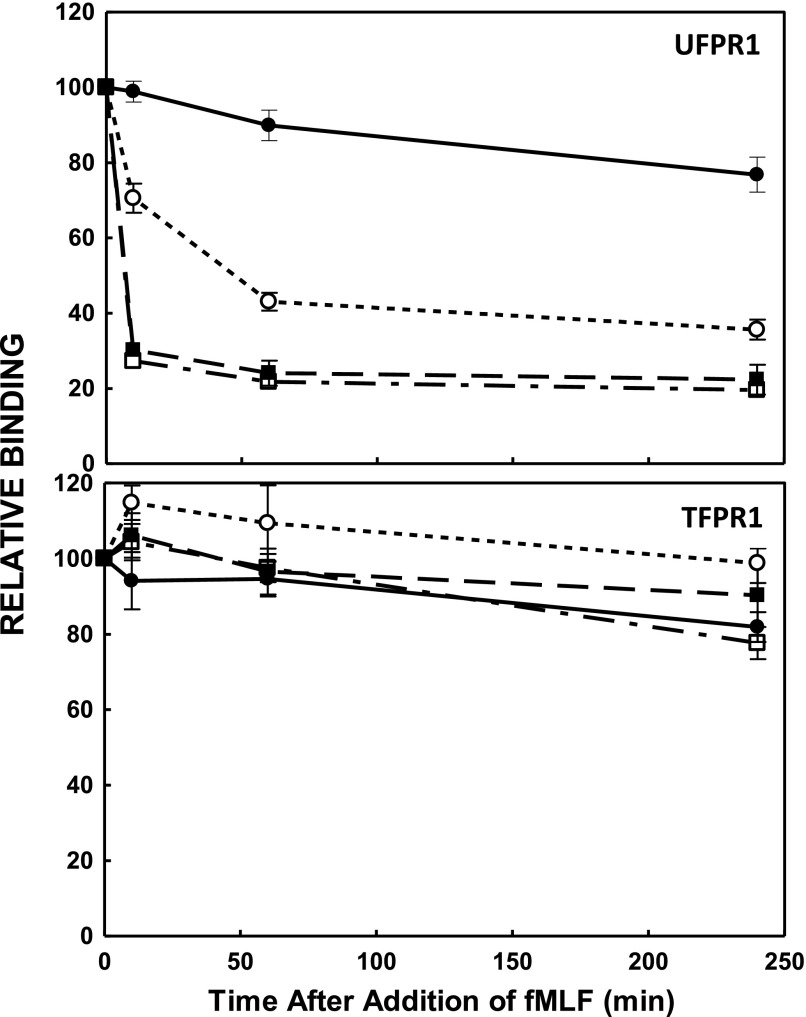
Figure 2. Kinetics of fMLF-induced sensitivity of mAb NFPRa and NFPRb binding to FPR1 in immunoblots.
PMN, prepared as in Fig. 1, were exposed to 1 µM fMLF for the indicated time periods and lysed as described in Materials and Methods. Cell equivalents (1.5 × 10⁵) were solubilized and separated by SDS-PAGE, followed by immunoblotting, as described in Fig. 1. The binding of mAb NFPRa and mAb NFPRb to FPR1 (TFPR1 and UFPR1, respectively; relative to the t = 0, and [fMLF] = 0 value) was calculated from the signal intensities determined by LiCor infrared fluorescence and image analysis. These values are plotted as a function of the time of incubation of the cells with fMLF or vehicle at 37°C. The relative NFPRb binding to FPR1 (UFPR1), after 0, 10, 60, and 240 min stimulation with fMLF, is plotted (upper) for exposures to 0 (●), 10−8 M (○), 10−7 (▪), and 10−6 (□) M fMLF. (Lower) The same samples probed with NFPRa (TFPR1).

