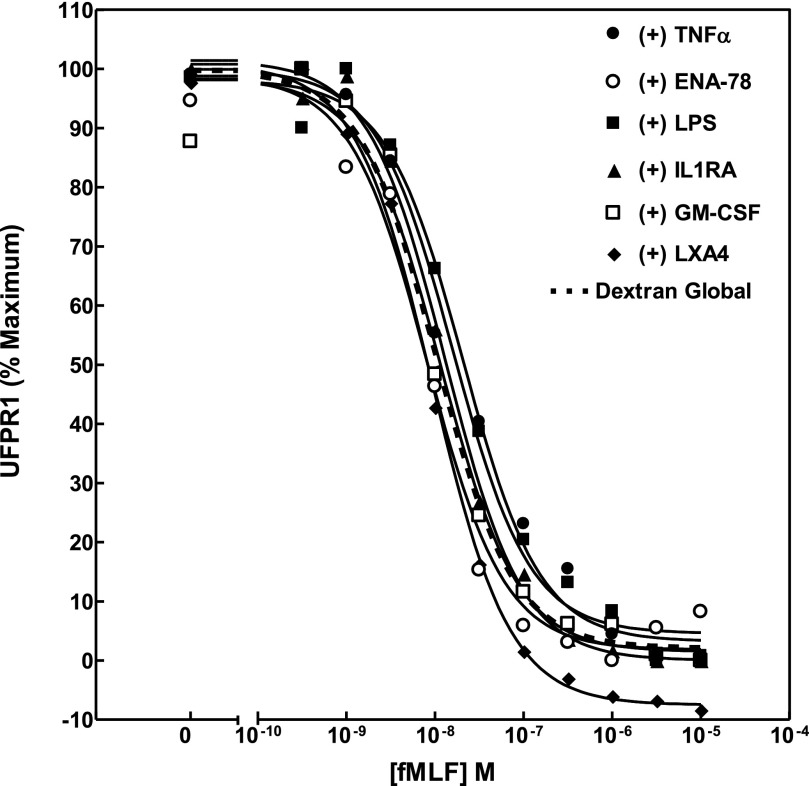
Figure 5. Comparison screen of the effect of modulators of inflammation on the sensitivity of levels of UFPR1.
Unprimed human PMN were prepared by the Dextran/Ficoll method and exposed at 37°C to 2.5 ng/ml TNF for 10 min, 100 ng/ml ENA-78 for 10 min, 100 ng LPS for 1 h, 100 nM IL-1RA for 10 min, and 10 ng/ml GM-CSF or 1 µM LXA4 for 10 min before processing, as described in Fig. 1. The average UFPR1 values for each condition are plotted as a function of fMLF concentration, to which PMN were exposed. The dotted line represents the average of all of the control values for all paired experiments conducted on Dextran prepared cells. Table 2 presents the calculated EC50 for each experimental condition, the 95% confidence interval, as well as the calculated P values for comparison of the paired EC50 in each experimental vehicle control with the experimental test values for each cytokine exposure.

