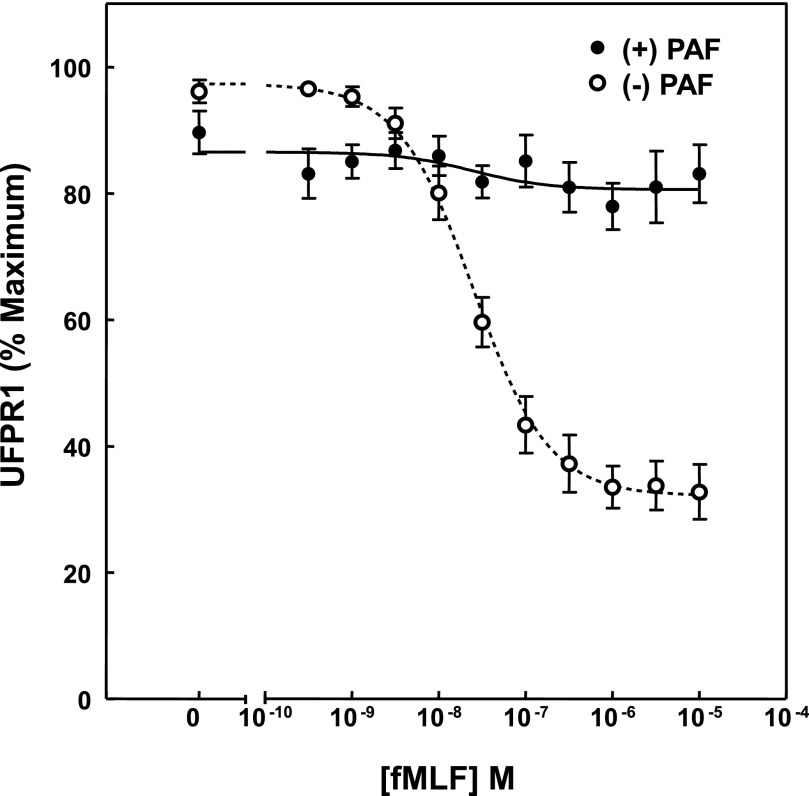
Figure 6. PAF inhibits fMLF-stimulated UFPR1 decreases.
PMN, prepared by gelatin method, were in preincubated for 10 min at 37°C in cell buffer containing vehicle (○) or 100 nM PAF (●). The exposure was followed by 10 min of stimulation with the indicated concentration of fMLF. The average UFPR1 values for each condition were determined, as indicated in Fig. 1, and are plotted as a function of fMLF concentration, to which PMN were exposed. The dotted and solid lines represent the nonlinear regression curve fits determined by GraphPad Prism analysis to averages of all of the control values for all paired experiments conducted on Dextran-prepared cells.

