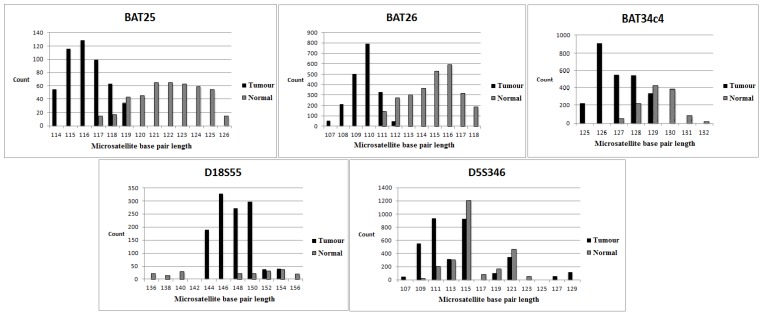
Figure 2.
Data derived from NGS-MSI-High tumour. The upper and lower panels correspond to three mononucleotide loci and two dinucleotide loci, respectively. The tumour and normal tissue are represented by the black and grey columns, respectively. There is a deletion in the base pair length (3–6 base pairs) for each mononucleotide locus in the tumour compared to normal tissue. D18S55 demonstrates an allelic loss and deletion (8 base pairs) in the base pair length. D5S346 shows expansion and deletion (4–8 base pairs) in the base pair length.

