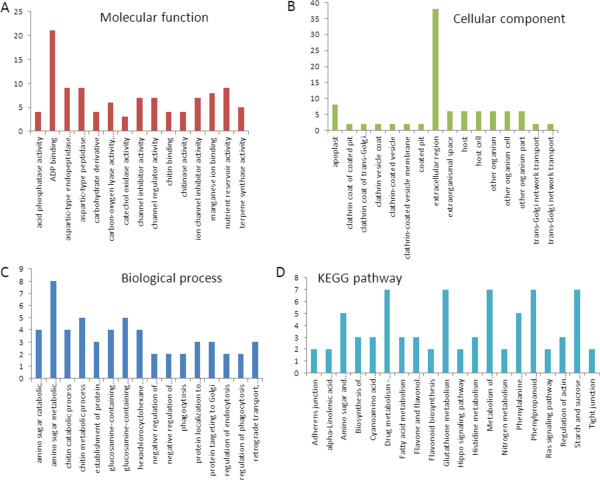
Figure 3.

Proportions of DEG unigenes categorised by comparison with the GO and KEGG databases. (A) Functional classifications based on GO in the molecular function category; (B) functional classifications based on GO in the cellular component category; (C) functional classifications based on GO in the biological process category; and (D) functional classifications based on KEGG pathways. The y-axis indicates the number of unigenes in a given main category. The x-axis indicates the specific sub-categories of unigenes in that main category.
