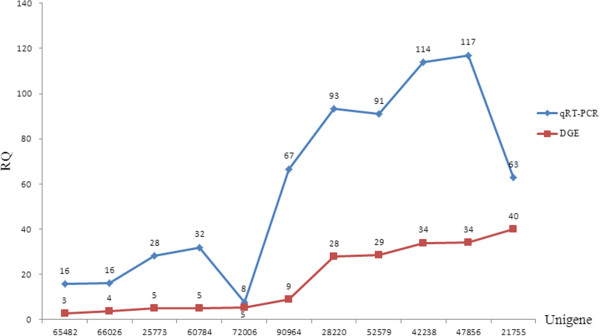
Figure 4.

Unigene expression tendencies in both DGE sequencing data and qRT-PCR experimental results. The x-axis shows the different unigenes, and the y-axis represents the drought quantity relative to control levels. The numbers shown above the two graphs indicate the fold changes for each unigene for the drought treatment relative to control conditions.
