
Figure 1.
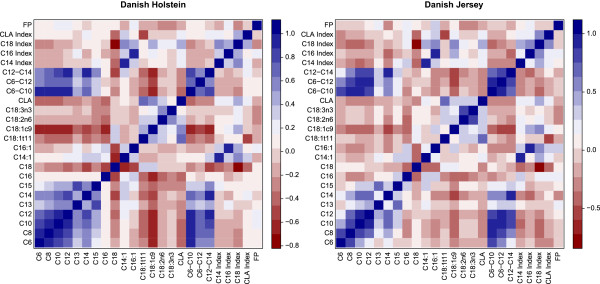
Genetic correlation estimated based on the t-values from the association study between the different individual fatty acids and groups of fatty acids in the Danish Holstein breed and Danish Jersey breed. The red colour represent a negative correlation, the blue colour represents a positive correlation.