Figure 2.

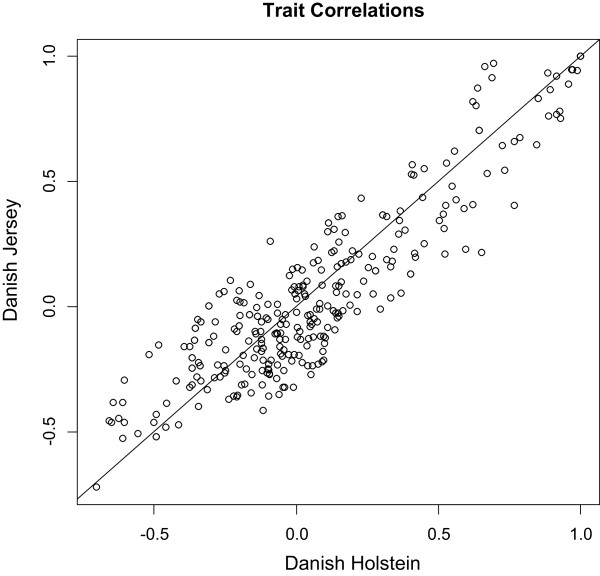
Correlation between the correlations for individual fatty acids and groups of fatty acids within Danish Holstein (x-axis) and Danish Jersey (y-axis).

Correlation between the correlations for individual fatty acids and groups of fatty acids within Danish Holstein (x-axis) and Danish Jersey (y-axis).