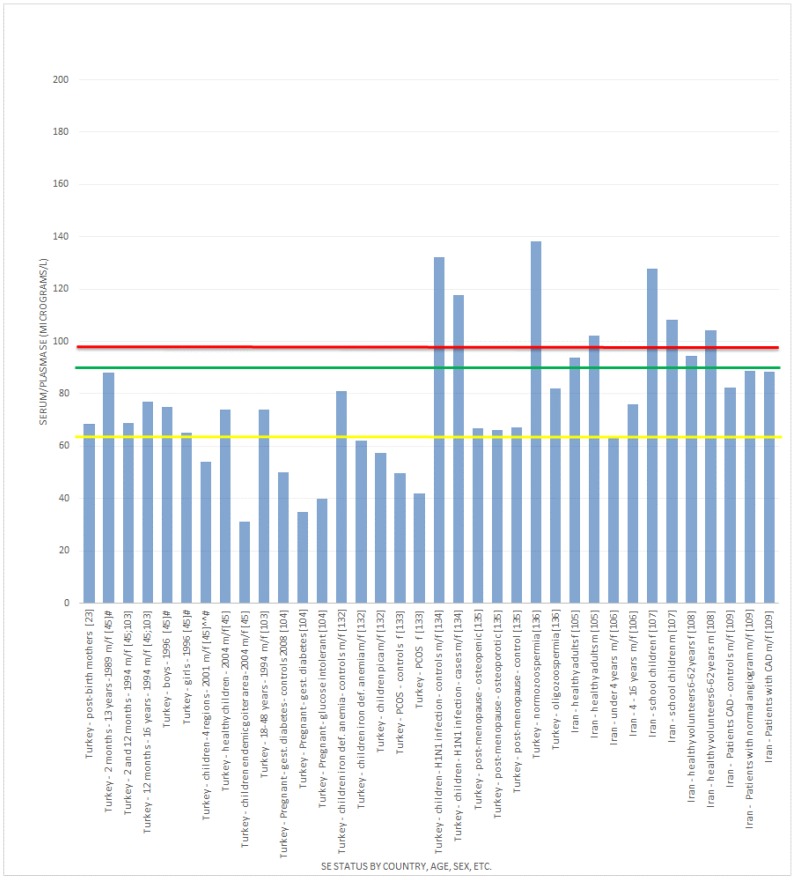
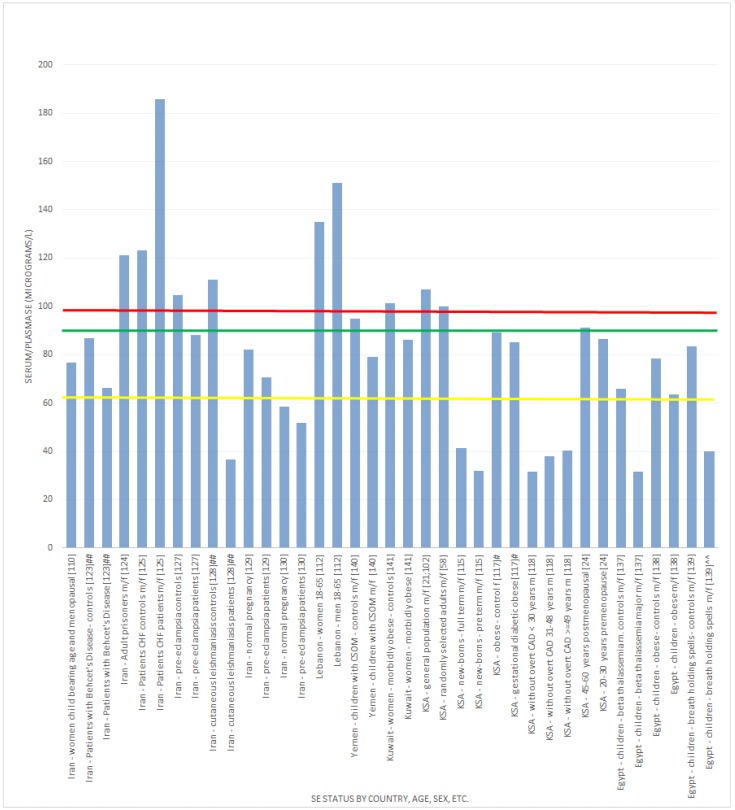
Figure 3.
Se status (Middle East regions) versus Se concentration required to optimise plasma GPx activity. ^^ calculated average; # not clear if it is a mean value; f = female; m = male; ## sex not established. The red line  , indicates concentration required to optimise plasma GPx activity according to Alfthan et al. (98.7 μg/L) [8]. The green line
  , indicates concentration required to optimise plasma GPx activity according to Duffield et al. (90.01 μg/L) [7]. The yellow line
  , indicates concentration required to optimise plasma GPx activity according to the WHO (63.16 μg/L) [61].


