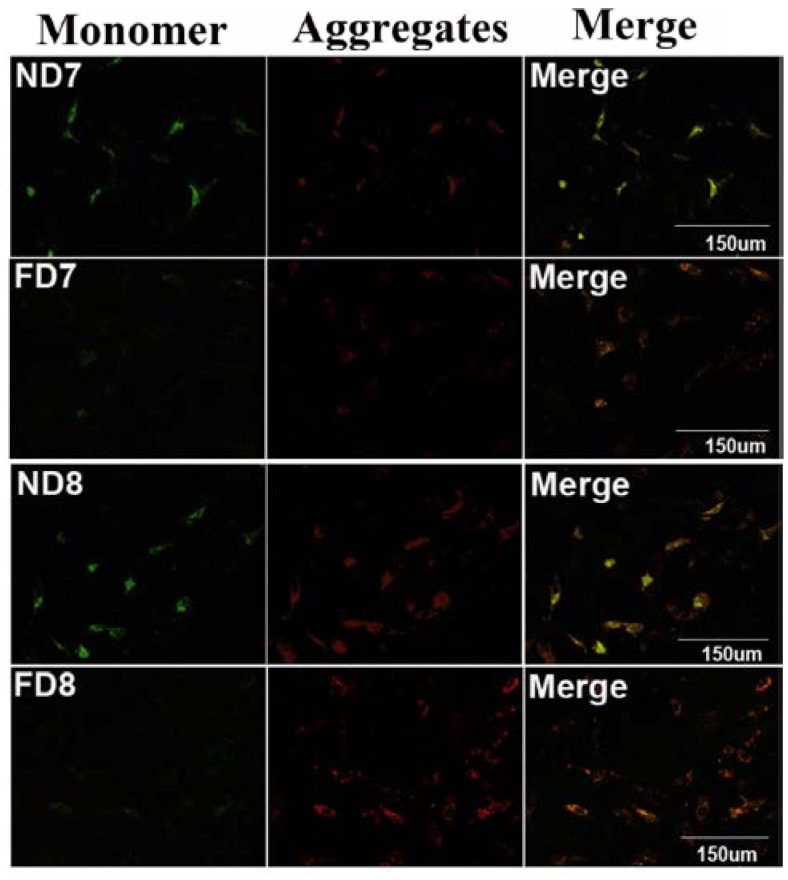
Figure 4.
Mitochondrial transmembrane potential (ΔΨm) of mouse endometrium decidual cells did not decrease following folate deficiency treatment (×200). Green fluorescence represents monomeric JC-1 in the cytoplasm (left panel), while red fluorescence represents JC-1 aggregates accumulating in the mitochondria due to a high mitochondrial membrane potential (middle panel). ND7, pregnant mice on 7th d.o.p. of normal group. ND8, pregnant mice on 8th d.o.p. of normal group. FD7, pregnant mice on 7th d.o.p. of folate-deficient group. FD8, pregnant mice on 8th d.o.p. of folate-deficient group.

