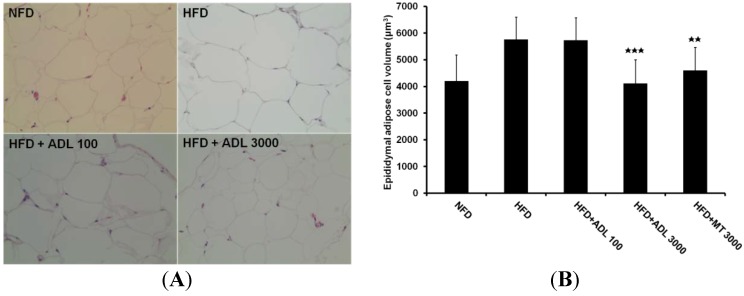
Figure 1.
Histology of epididymal adipose (A) and liver (C) tissues of mice fed experimental diets for six weeks (magnification= ×200). Normal-fat diet (NFD), high-fat diet (HFD), high-fat diet with 100 mg·kg−1·day−1
Allomirina dichotoma larva suspension (HFD + ADL 100), and HFD with 3000 mg·kg−1·day−1 ADL (HFD + ADL 3000). Epididymal adipose cell volume measured by IMT i-Solution Lite program (B). Histopathology of the liver with steatosis. Arrows indicate the macrovesicular lipid droplets in the cytoplasm of hepatocytes (C). Results are expressed as mean ± SD (n = 3). Statistical significance was evaluated by Duncan post-hoc test in ANOVA.  p < 0.001 and
  p < 0.01, compared to the high-fat diet group.


