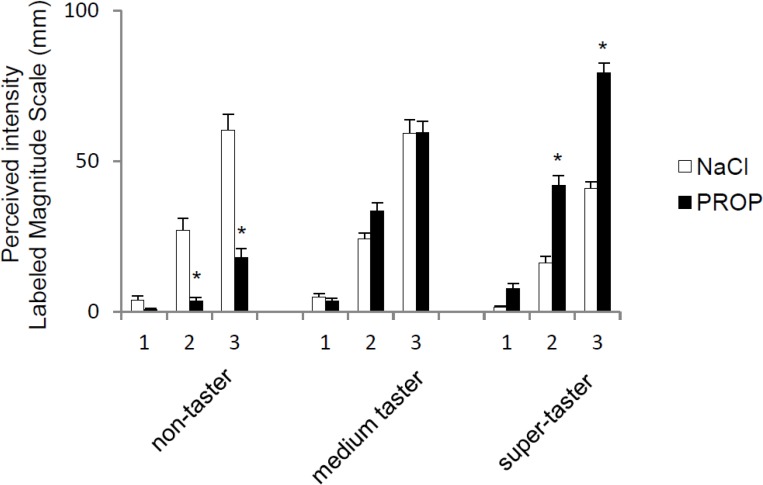
Figure 2.
Relationship between perceived taste intensity and stimulus concentration in PROP non-tasters (n = 21), medium tasters (n = 27), and super-tasters (n = 16). All values are mean (±SEM). The numbers 1, 2, and 3 on the x-axis correspond to three NaCl and PROP solutions (NaCl: 0.01, 0.1, 1.0 mol/L) and (PROP: 0.032, 0.32, and 3.2 mmol/L). * Significant difference between PROP and the corresponding sodium chloride concentration (p < 0.0001; Tukey Post hoc test subsequent three-way ANOVA).

