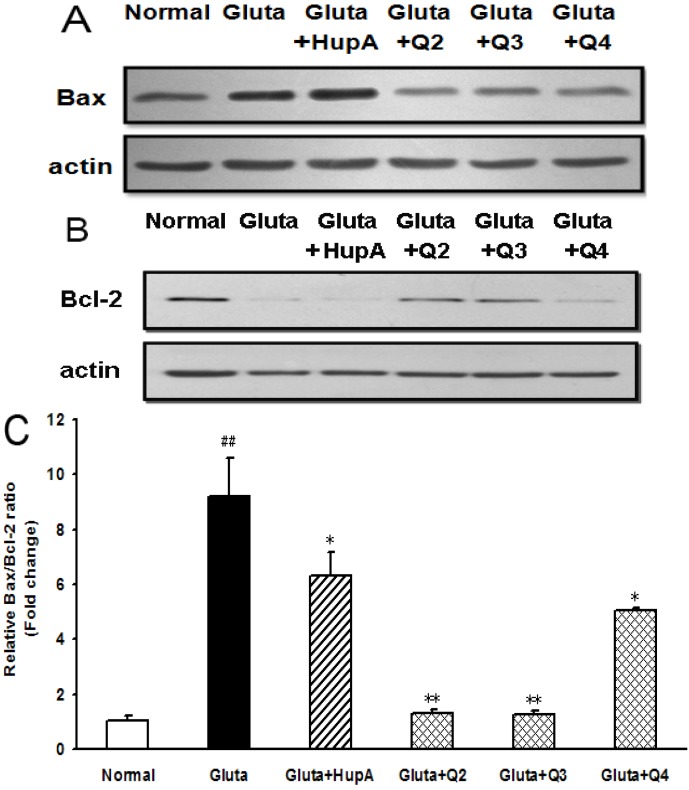
Figure 9.
Effect of PACOs on the expression of Bax and Bcl-2 in PC12 cells. (A–B) After being pretreated with 200 μg/mL of different PACO monomers Q-2, Q-3 and Q-4 for 2 h and 4 mM of glutamate for another 24 h, the levels of Bax (A) and Bcl-2 (B) were measured by western blot. Blots were also probed for β-actin as loading controls. The result shown is a representative of three separate experiments with similar results; (C) Quantification of immunoblot for the ratio of Bax and Bcl-2. The ratio for non-treated normal control cells was assigned values of 1.0. Values are the mean ± SD (n = 3). Significance: ## p < 0.01 vs. normal control group; * p < 0.05, ** p < 0.01 vs. glutamate treated control group.

