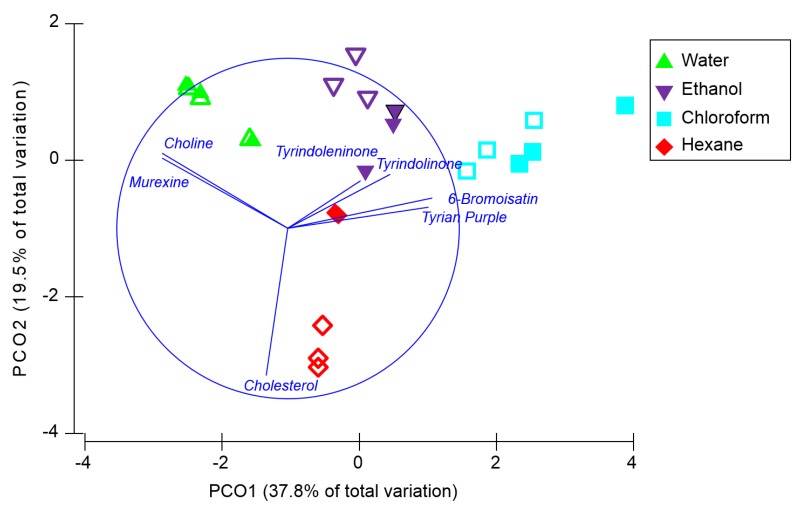
Figure 4.
Principal coordinate analysis based on the normalised relative intensities of secondary metabolites detected after solvent separation on NALDI (open symbols) and DIOS (filled symbols) surfaces, grouped according to the type of solvent used (n = 3). Trajectory overlay is based on Pearson correlations (r > 0.3).

