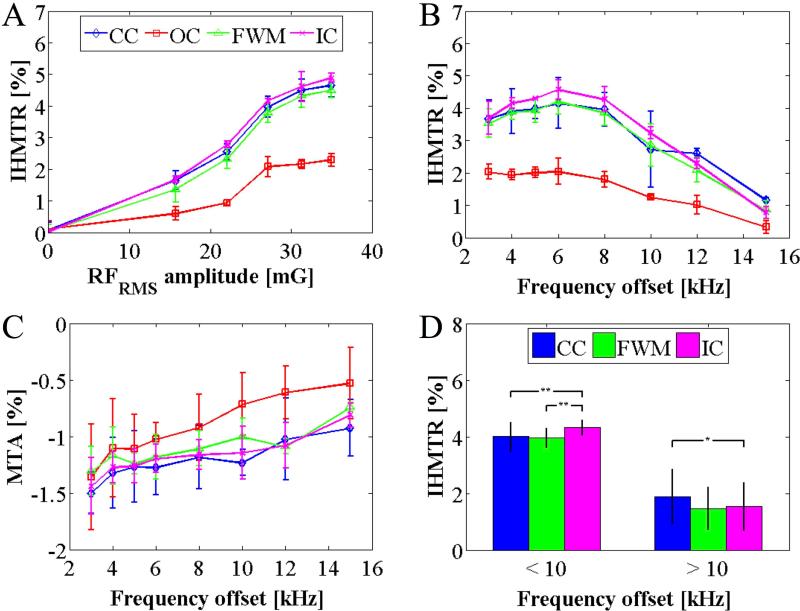
Figure 7.
RF power and frequency dependence of IHMT and MT asymmetry from the continuous wave studies. Average IHMTR values, across the 3 volunteers from ROIs in calculated quantitative maps, as a function of RFRMS irradiation intensity, (A), and frequency offset, (B), and also MT asymmetry as a function of frequency offset, (C), are plotted. Averaging of the IHMTR data from WM ROIs at frequency offsets below and above 10kHz shows significant differences using one-tailed, paired student T-tests (*p < 0.05; **p < 0.01), D. Error bars represent the standard deviation in the average value (from ROIs) across the volunteers.

