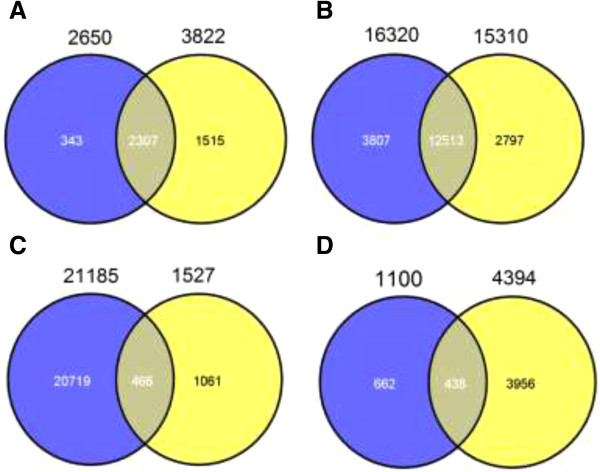
Figure 6.

Venn diagram of differentshared and uniquetranscripts in PBNT and BBNT embryos. A. Venn diagrams showing the same down-regulated genes between iSCNT embryosvs bovine oocytesand SCNT embryosvs bovine oocytes (2,307 genes). The blue circle (2,650 genes) indicates the number of down-regulated genes in iSCNT embryosvs the bovine oocytes, and theyellow circle (3,822 genes)indicates the number of down-regulated genes in the SCNT embryosvs the bovine oocytes. B. Venn diagram showing the same non-regulated genes between iSCNT embryosvs Przewalski’s gazelle fibroblasts and SCNT embryosvs bovine fibroblasts (12,513 genes). The blue circle (16,320 genes) indicates the number of non-regulated genes in the iSCNT embryosvs the Przewalski’s gazelle fibroblasts, andyellow circle (15,310 genes)indicates the number of non-regulated genes in the SCNT embryosvs bovine fibroblasts. C. Venn diagram showing common gene expression between iSCNT and SCNT embryos (466 genes). The blue circle denotes transcripts that have similar expression levels between iSCNT embryos vs SCNT embryos (21,185 genes), andthe yellow circle indicates reprogrammed transcriptomes in SCNT embryos (1,524 genes). D. Venn diagram showing somatic gene expression in 8- to 16-cell stage iSCNT embryos (438 genes) compared toSCNT embryos. The blue circle denotes up-regulated genes in iSCNT compared to SCNT embryos (1,100), and yellow circle denotes up-regulated genes in bovine fibroblasts compared to SCNT embryos (4,394).
