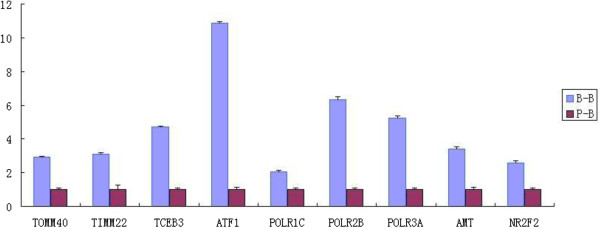
Figure 7.

Quantification of relative abundance of nine transcripts between the 8–16 cell stage of the embryos (72h post activation). Przewalski’s gazelle-bovine interspecies SCNT embryos (P-B) and bovine intra-species SCNT embryos(B-B) in expression of nine select genes as determined by quantitative PCR. Data are presented as mean value of triplicate measurements including standard errors.
