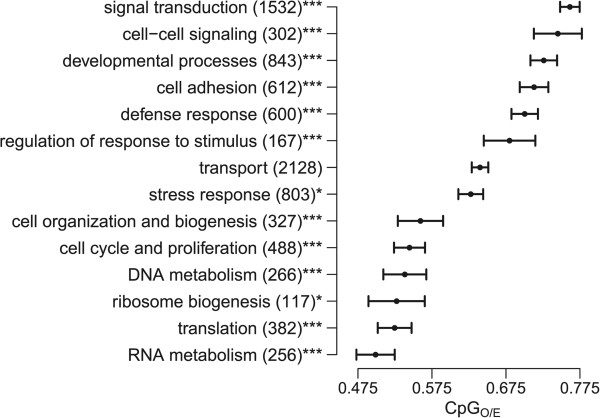
Figure 2.

Variation of CpG O/E among genes assigned to different biological processes. Each bar represents mean CpGO/E for the indicated biological process and its standard error. Asterisks indicate significance of enrichment in the low- or high-CpG components (*< 0.05, **< 0.01, ***< 0.001; Fisher’s exact test).
