Figure 3.

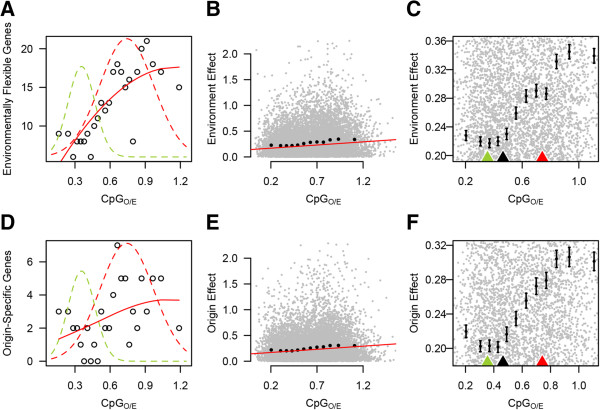
Genes with high CpG O/E are more likely to be differentially expressed between environments. (A) Frequency of environmentally flexible genes increases with CpGO/E. All genes with expression data were divided into 25 quantiles based on CpGO/E (503 genes per quantile). Each data point represents the count of environmentally flexible genes (adjusted P-value < 0.01) within a single quantile and the mean CpGO/E for the quantile. To illustrate associations with the CpGO/E components, the density component curves from figure 1A were traced over the count data. (B) Across all genes the magnitude of differential expression due to environment (environment effect) showed a positive relationship with CpGO/E. The red line indicates the linear model of the relationship between environmental effect and CpGO/E. Black error bars represent the mean and standard error for environmental effect of 12 quantiles based on CpGO/E. (C) Same as (B), rescaled to illustrate that mean environment effect increases sharply under the high-CpG component. Green and red arrows along the x-axis illustrate the means for each component curve. The black arrow indicates their point of intersection. (D-F) Same as A-C, but for the effect of coral origin rather than of transplant site.
