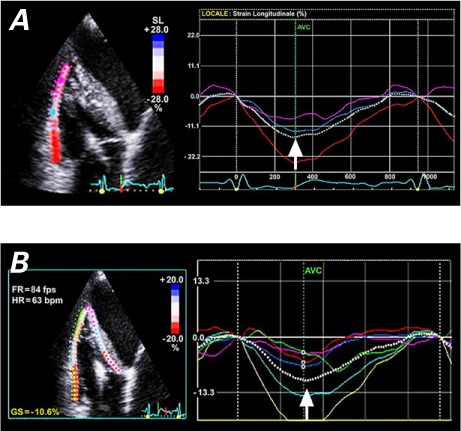
Fig. 5.

Two-dimensional speckle-tracking echocardiography (transthoracic apical off-axis view) was used to measure A) right ventricular free wall longitudinal strain (RVFWLS) and B) right ventricular global longitudinal strain (RVGLS). In A), the manual tracing of the RV free wall endocardial border (left) delineates a region of interest including the basal, mid, and apical segments. The RVFWLS curve (right, dashed white line) shows excellent global longitudinal performance, with a peak value of −16% (arrow). The highest values are seen in the basal segment (red line), intermediate values in mid-wall segment (blue line), and lower values in the apical segment (violet line). Longitudinal function progressively decreases from the basal to the apical segment of RV free wall. In B), the manual tracing of the RV endocardial border (left) delineates a region of interest including 6 segments: the basal, mid, and apical segments of the RV free wall, and the basal, mid, and apical segments of the ventricular septum. The average peak value of the RVGLS curve (right, dashed white line) is −11% (arrow). A gradient of longitudinal function decreasing from the RV free wall to the interventricular septum and from base to apex is evident.
