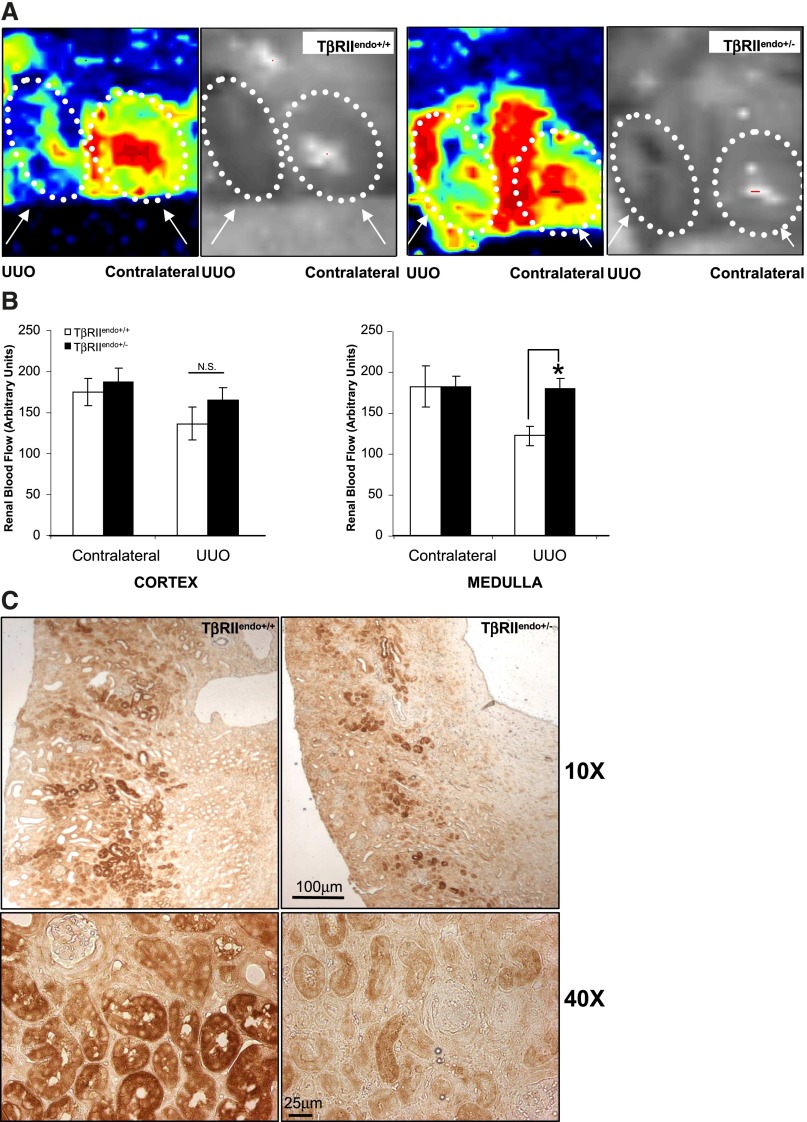
Figure 7.
Renal blood flow measurement and pimonidazole staining in kidneys of TβRIIendo+/+ and TβRIIendo+/− UUO mice. (A) Representative image scans from laser-Doppler flowmetry analysis of contralateral and UUO kidneys from TβRIIendo+/+ and TβRIIendo+/− mice (n=3). (B) Quantification of cortex and medullary renal blood flow in kidneys. *P<0.001, TβRIIendo+/+ and TβRIIendo+/− UUO mice. (C) Immunohistochemical staining for pimonidazole adducts in UUO kidneys of TβRIIendo+/+ and TβRIIendo+/− mice. Original magnification, ×10 and ×40.

