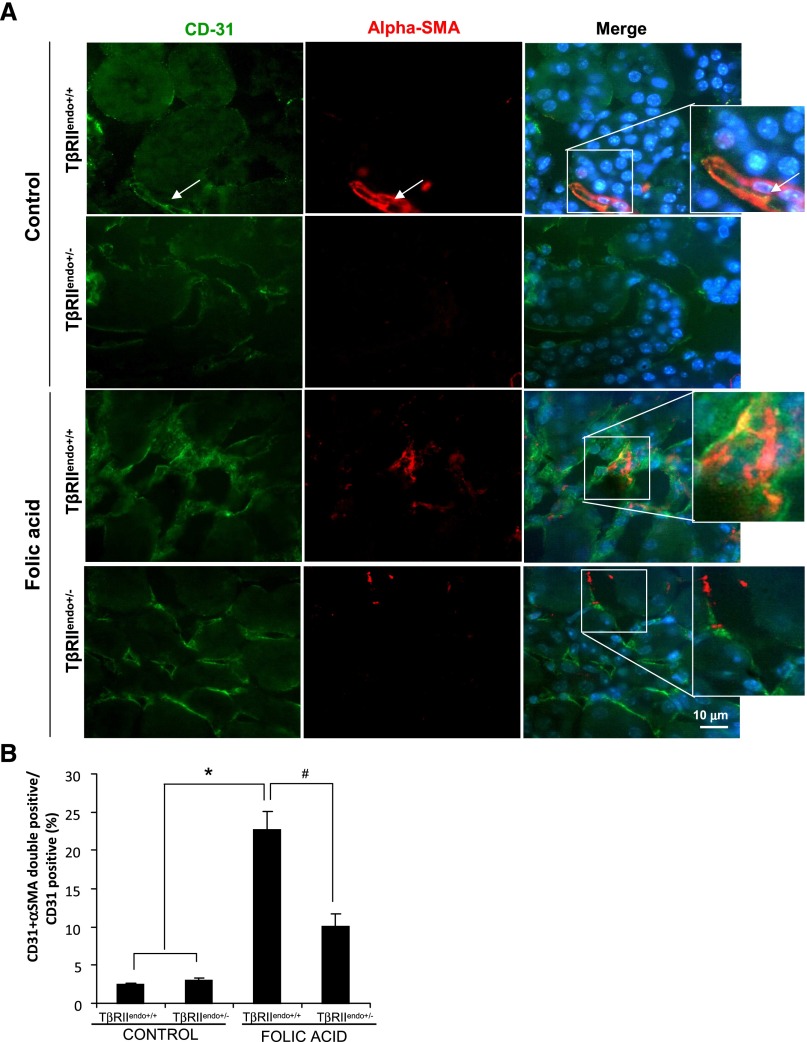
Figure 8.
EndoMT in mice with FA nephrotoxicity. (A) Representative images for CD31 (green) and α-SMA (red) staining (n=5). Wild-type control kidneys shows costaining for CD31 and α-SMA only in vessels. These areas were excluded during quantitative analysis. (B) Quantitative analysis of CD31 plus α-SMA double-positive cells in TβRIIendo+/+ or TβRIIendo+/− vehicle- or FA-treated mice. *P<0.01; #P<0.01. Original magnification, ×60.

