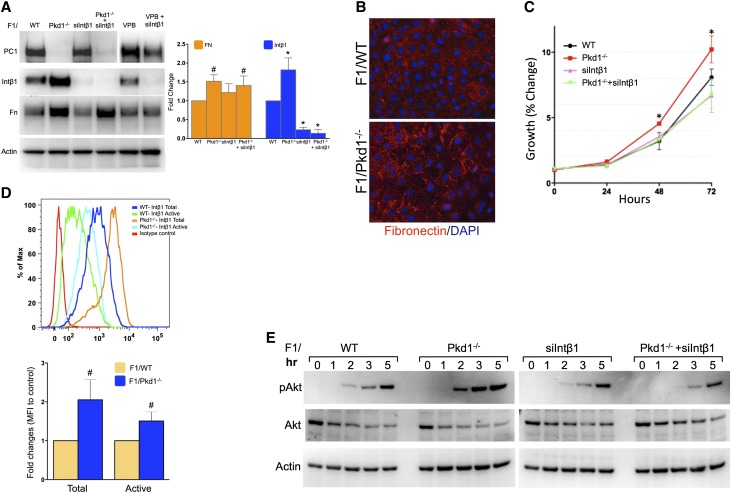
Figure 1.
Ablation of Pkd1 increases activated Intβ1 and fibronectin expression. (A) Expression of PC1, Intβ1, and fibronectin in F1/WT cells before and after the ablation of Pkd1 (Pkd1−/−) and/or the knockdown of Intβ1 (siIntβ1). The bar graph in the right panel shows the quantification of the protein expression as fold change with respect to WT from five independent experiments. (B) Fibronectin immunostaining before and after Pkd1 ablation in F1 cells. (C) The knockdown of Intβ1 expression reverts the hyperproliferation of PC1-ablated cells. (D) The levels of total (MB1.2) and active (9EG7) Intβ1 were analyzed by FACS in the different cell populations. Isotype antibody and F1/siIntβ1 cells were used as controls. Upper panel shows a profile representative of three independent experiments. The bar graph in the lower panel shows the relative fold increase in mean fluorescence intensity (MFI) of Pkd1−/− versus WT. (E) Immunoblot detection of phosphorylated and total Akt expression in different cell populations stimulated for the indicated times (hours) with Mn2+ and collagen. Actin was used as gel loading control. Statistical comparison was performed by two-way ANOVA with (A and C) Bonferroni post-test and (D) two-tailed t test. FN, fibronectin. *P<0.001; #P<0.05.

