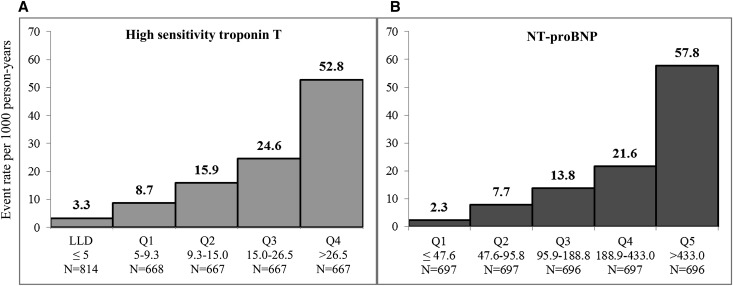
Figure 2.
Crude rates of incident HF per 1000 person-years of follow-up in the CRIC Study across categories of hsTnT and NT-proBNP. Events rates for hsTnT are shown for those with undetectable levels (≤5) and then by quartile among detectable levels; event rates for NT-proBNP are shown by quintile. LLD, lower limit of detection; Q, quartile.

