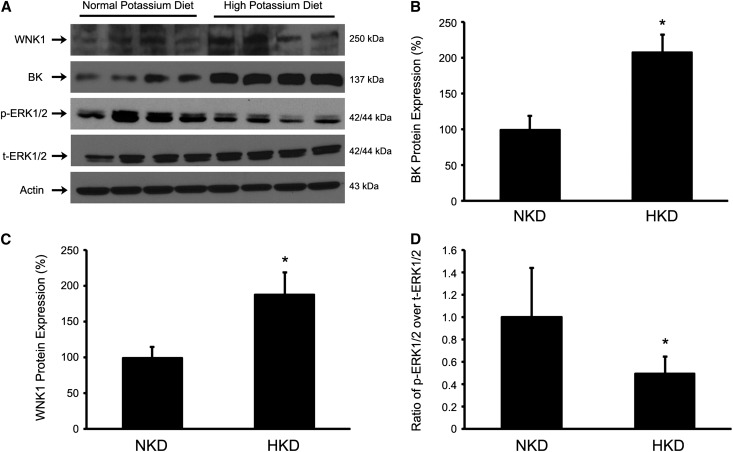
Figure 8.
The effects of high dietary K on protein expressions of WNK1 and BKα, and ERK1/2 phosphorylation in normal mice. Mice were fed with NK (1%) diet (8 mice) or HK K (10%) diet (8 mice) for 10 days. After 10 days of dietary K challenges, kidneys were harvested for Western blot analysis. (A) Representative immunoblots for WNK1, BK, phospho-ERK1/2, total-ERK1/2, and actin. Bar graphs show mean±SD band densities of BK (B), WNK1 (C), and ratio of p-ERK1/2 over t-ERK1/2 (D). BK and WNK1 protein expressions were significantly increased in the HK group compared with those in the NK group, whereas ERK1/2 phosphorylations were significantly reduced in HK group compared with those in NK group. n=8; *P<0.05.

