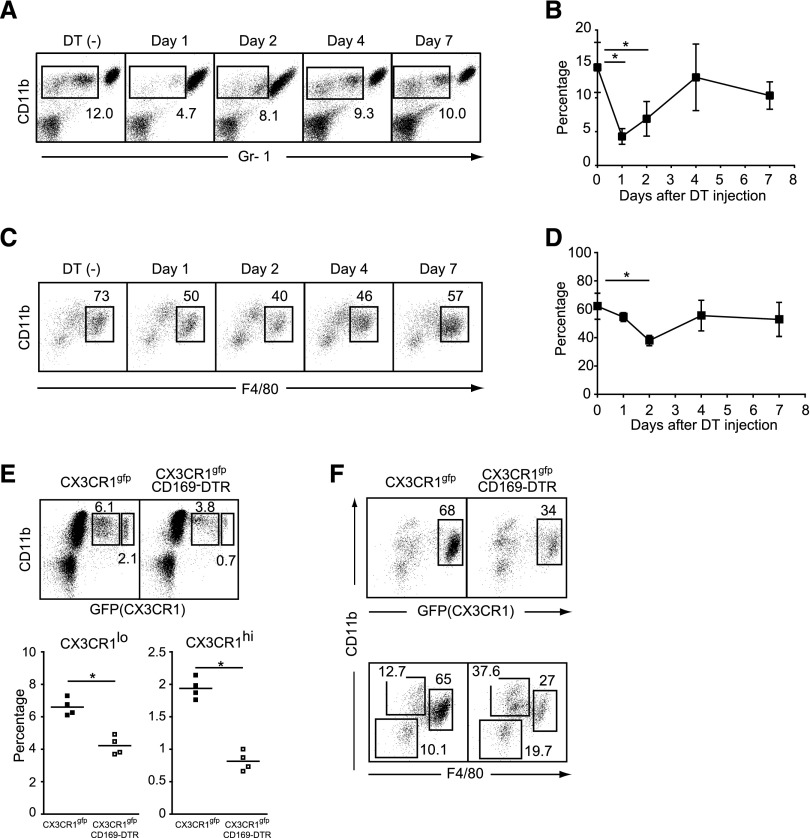
Figure 2.
Selective depletion of monocytes and kidney macrophages in CD169-DTR mice. (A) White blood cells of DT-treated CD169-DTR mice at the indicated time points were stained with CD11b and Gr-1 antibodies. Numbers indicate the frequency (percentage) of CD11b+Gr-1int-lo monocytes among white blood cells. Average percentages of CD11b+Gr-1int-lo monocytes (three to five mice per group) are plotted with SD in B. Mean percentage of CD11b+Gr-1int-lo cells was compared by one-way ANOVA. *P<0.05. (C) Kidney macrophages of DT-treated CD169-DTR mice at the indicated time points were stained for Gr-1, CD11b, and F4/80 antibodies. Numbers indicate the frequency (percentage) of CD11b+F4/80+ kidney macrophages among CD11b+ and/or CD11c+ cells in kidneys. Average percentages of CD11b+, F4/80+ kidney macrophages (four mice per group) are plotted with SD in D. Mean percentage of CD11b+F4/80+ cells was compared by one-way ANOVA. *P<0.05. (E) Depletion of monocytes in CX3CR1-GFP×CD169-DTR mice. DT was injected into CX3CR1-GFP mice (upper left panel) or CX3CR1-GFP×CD169-DTR mice (upper right panel). Twenty-four hours later, white blood cells were stained for CD11b. Numbers indicate the frequency (percentage) of CX3CR1lo or CX3CR1hi cells among white blood cells. (Lower panel) Average percentages of CX3CR1lo and CX3CR1hi cells are plotted. ▪, CX3CR1-GFP; □, CX3CR1-GFP × CD169-DTR. *P<0.05. (F) Depletion of kidney macrophages in CX3CR1-GFP × CD169-DTR mice. DT was injected into (left panel) CX3CR1-GFP or (right panel) CX3CR1-GFP×CD169-DTR mice. Two days after the DT injection, kidney macrophages were stained for CD11b and F4/80. Numbers indicate (upper panel) the frequency (percentage) of CX3CR1-positive cells among CD11b+ and/or CD11c+ cells in kidneys or (lower panel) the frequency (percentage) of CD11b and F4/80 double-negative, CD11b single-positive, or CD11b and F4/80 double-positive cells among CD11b+ and/or CD11c+ cells in kidneys. Data are representative of three independent experiments.

