Figure 2.
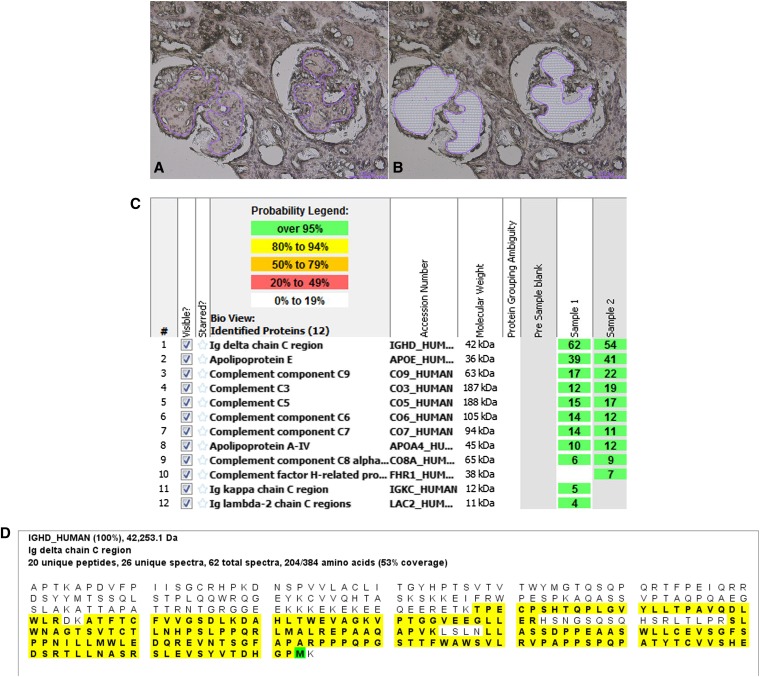
Laser microdissection and mass spectrometry results. LMD/MS. Light microscopy showing (A) glomeruli marked for dissection and (B) empty space after microdissection (hematoxylin and eosin, ×20). (C) LMD/MS results. Scaffold 2 display of proteomic data. The figure shows proteomics data from two microdissected samples (samples 1 and 2) from the biopsy showing the presence of large spectra numbers for IgD. Apolipoproteins E and A-IV are also present. In addition, spectra for C9, C3, C5, C6, and C7 are also detected. The probability number (>95% is highlighted by green, and 80%–94% is highlighted by yellow) indicates essentially the percentage of homology between peptides detected in the specimens and the published amino acid sequences of their corresponding proteins. (D) Representative sequence (peptide) coverage of the IgD detected in the microdissected sample showing 62 total spectra, 26 unique spectra, and 20 unique peptides for 53% coverage of IgD protein with 100% probability. The figure shows the entire IgD peptide sequence; the peptides highlighted in yellow represent the unique peptides found in the microdissected sample that map to IgD.

