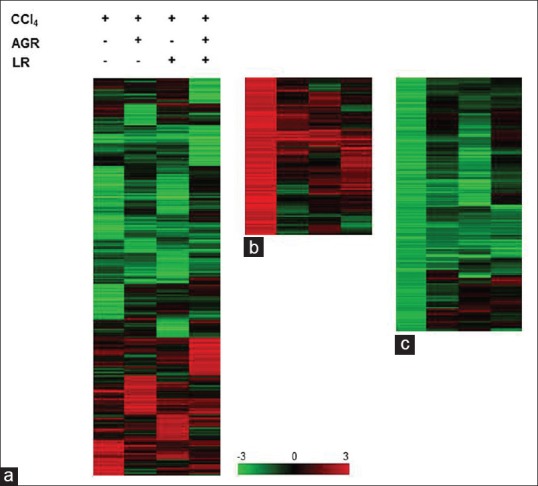
Figure 5.

Expression profiles of genes regulated by carbon tetrachloride (CCl4) and herbal medicines. Normalized microarray data were hierarchically clustered according to the level of gene expression. Columns represent each experimental group, and rows represent genes. Red and green indicates up- and down-regulation, respectively. Scale bar represents the color intensity corresponding to the expression ratio (logarithm of base 2). Cluster (a) shows expression profile of total genes (2,423 genes) according to treatment of herbal medicines followed by CCl4 treatment. A detailed view of the individual gene expression is shown in b and c. Cluster b (194 genes) consists primarily of genes that were up-regulated while cluster (c) (513 genes) consists primarily of genes that were down-regulated in response to CCl4 treatment
