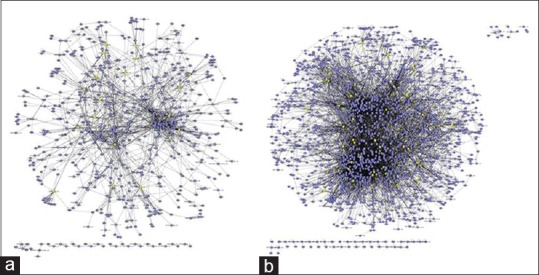
Figure 6.

Analysis of the interaction network. The first neighborhood of genes that were altered in response to carbon tetrachloride (CCl4) treatment was identified during analysis of the interaction network. The number of first neighborhood nodes of genes that were up-regulated in response to CCl4 was 537 (a) and the number of first neighborhood nodes of genes that were down-regulated was 1,501 (b) yellow nodes indicate core node genes that were altered by CCl4 treatment and had at least 10 interaction edges with other proteins
