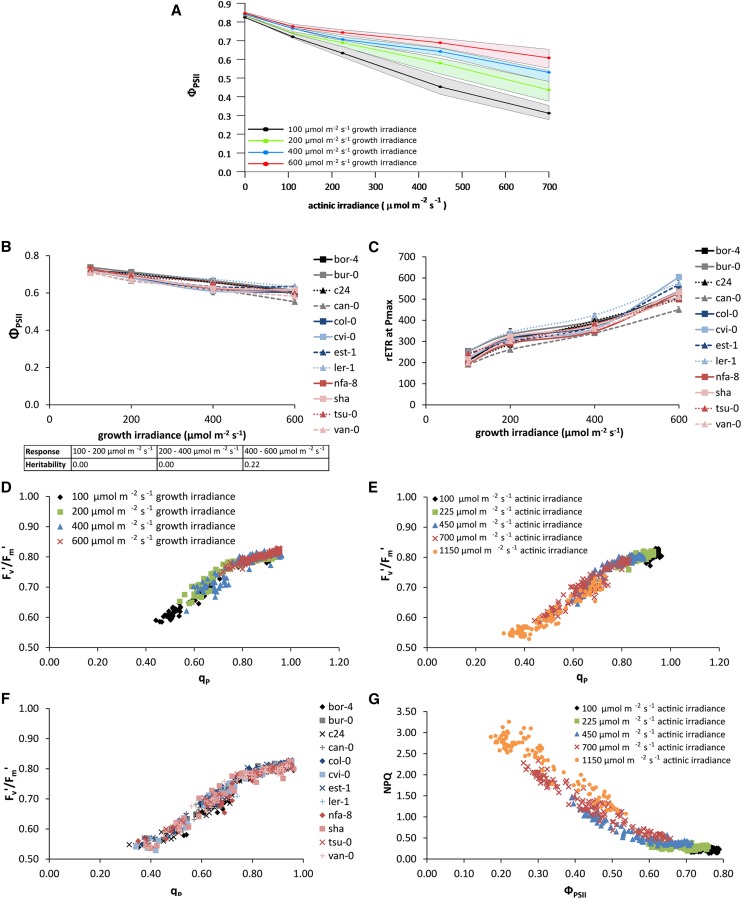
Figure 2.
ΦPSII of 12 Arabidopsis accessions grown in different constant growth irradiances: 100, 200, 400, or 600 µmol m−2 s−1. A, ΦPSII light response curves measured on 24-d-old plants after reaching steady-state photosynthesis in four different actinic irradiances: 100, 225, 450, and 700 µmol m−2 s−1. The lines represent the average of all accessions, and the area around each line represents the extent of deviation among the accessions (highest value minus lowest value in the population). B, Variation in ΦPSII among 12 Arabidopsis accessions when grown at four different constant growth irradiances (100, 200, 400, and 600 µmol m−2 s−1) for 24 d and measured at actinic irradiance identical to the growth irradiance. Error bars indicate se; n = 3. The inset shows the heritabilities of the response of these values to growth irradiance level. C, Variation in maximum rETR measured at saturating actinic irradiance (Pmax) among 12 accessions when grown at four different growth irradiances (100, 200, 400, and 600 µmol m−2 s−1) for 24 d. When grown at 100 µmol m−2 s−1, the saturating actinic irradiance level used was 600 µmol m−2 s−1; at 200 µmol m−2 s−1, this was 700 µmol m−2 s−1; at 400 µmol m−2 s−1, it was 800 µmol m−2 s−1; and at 600 µmol m−2 s−1, it was 1,150 µmol m−2 s−1. Error bars indicate se; n = 3. D, Correlation of Fv′/Fm′ and qp for different growth irradiances (100, 200, 400, and 600 µmol m−2 s−1). E, Correlation of Fv′/Fm′ and qp for different actinic irradiances (100, 225, 450, 700, and 1,150 µmol m−2 s−1). F, Correlation of Fv′/Fm′ and qp for each of the 12 different accessions of Arabidopsis. G, Correlation of NPQ and ΦPSII for different actinic irradiances (100, 225, 450, 700, and 1,150 µmol m−2 s−1).

