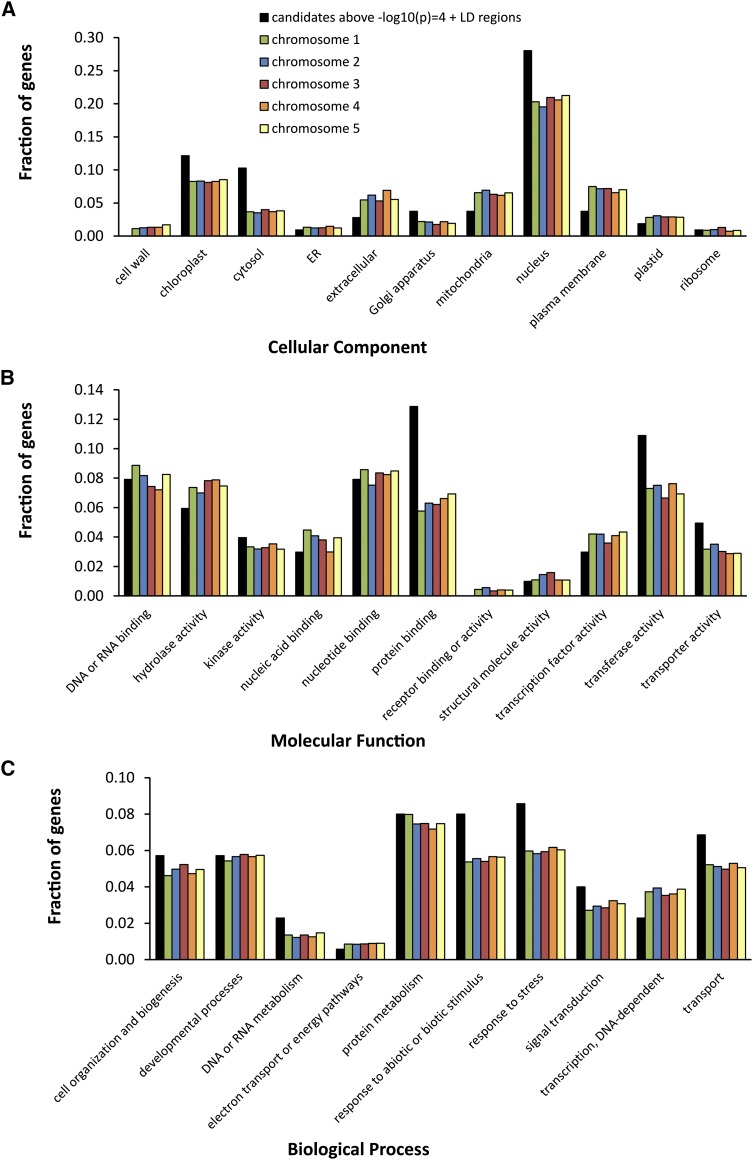
Figure 6.
Gene Ontology enrichment analysis for cellular component (A), molecular function (B), and biological process (C). The graphs depict the fractions of genes from a list [gene candidate list directly localized to, and in LD regions of, the SNPs associated in GWAS above –log10(p) = 4 and lists of all genes on chromosomes 1–5] annotated to different Gene Ontology categories.

