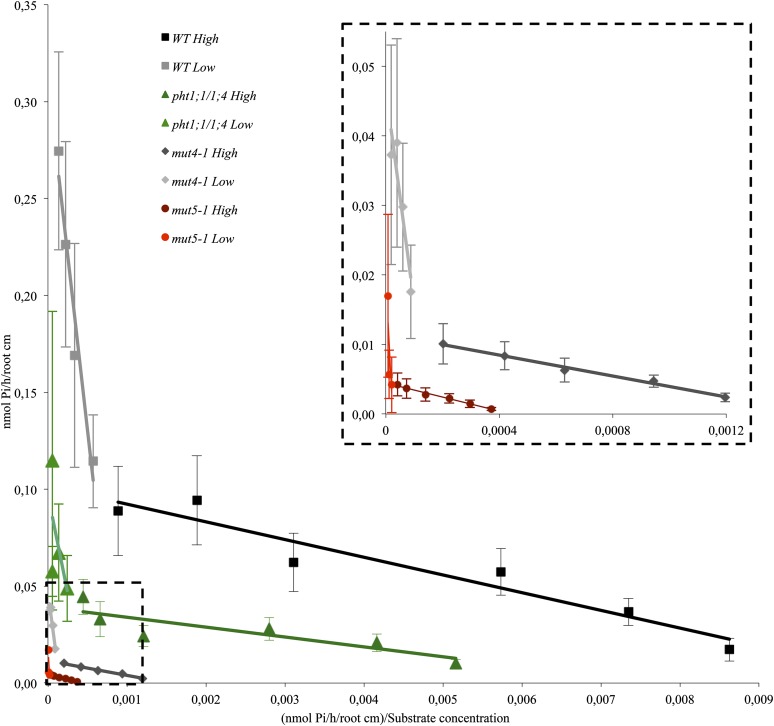
Figure 4.
33P uptake kinetics demonstrates that PHT1-depleted lines are affected both in low- and high-affinity transport. Eadie and Hofstee representation of the 33P uptake kinetic parameters. The experimental points are the mean ± sd of a representative experiment with at least 11 individual plantlets for each genotype and each condition. The dotted line insert is a magnified view of the dotted line selection in the main graph. High signifies high-affinity transport (2–100 μm Pi), and Low represents low-affinity transport (0.2–2 mm Pi). WT, Wild type.

