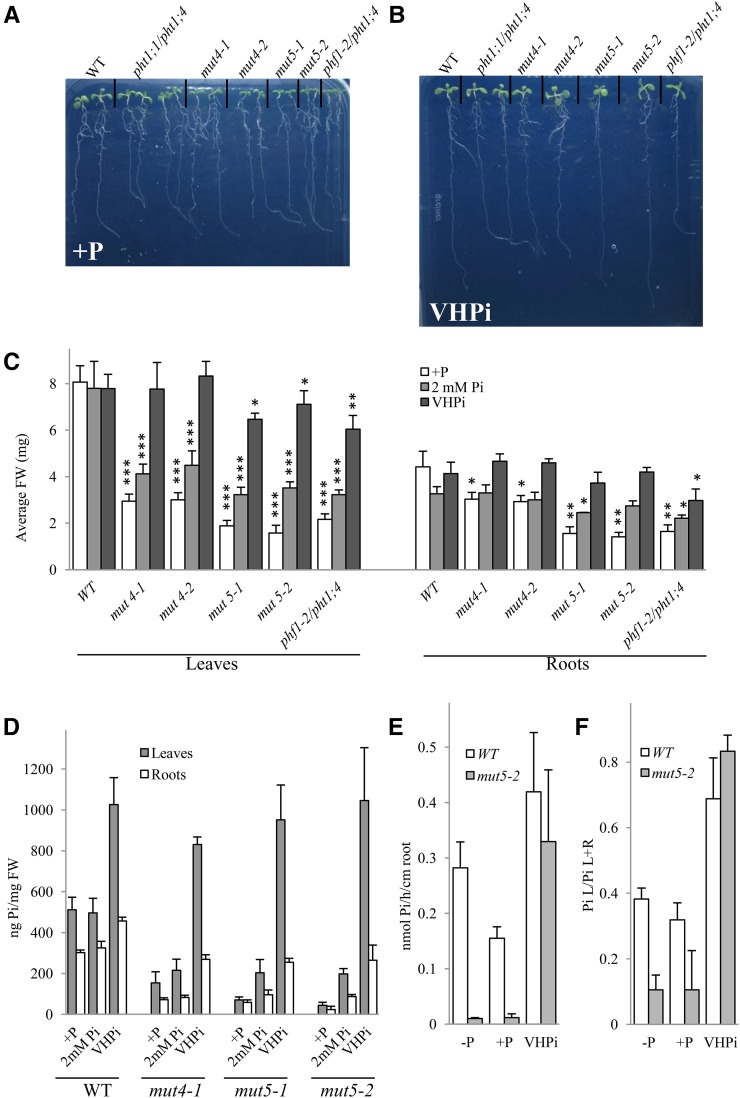
Figure 6.
Physiological characterization of mut4 and mut5 lines on VHPi. In vitro phenotyping of the lines used in this study in +P (A) and VHPi (10 mm Pi; B) at 8 dpg. C, Average biomass of leaves (left) and roots (right) in +P (white bars), 2 mm Pi (light-gray bars), and 10 mm Pi (dark-gray bars) at 12 dpg. Bilateral Student’s t tests were conducted to assess statistical differences between the wild type (WT) and the other genotypes for every growing condition and comparing leaves to wild-type leaves biomass and roots to wild-type root biomass. The single asterisk indicates P < 0.5; the double asterisk indicates P < 0.001, and the triple asterisk indicates P < 0.0001. D, Pi content in leaves (gray bars) and roots (white bars) of wild-type, mut4, and mut5 lines in +P, 2 mm Pi, and VHPi at 12 dpg. E, 33P uptake capacity of the wild type and mut5-2 in –P, +P, and VHPi growth/incubation conditions. F, 33P partitioning of the plants from E. For E and F, 20 to 24 plants were used for each genotype/condition, and plantlets were analyzed at 9 dpg. All experiments were repeated at least twice. FW, Fresh weight.

