Figure 7.
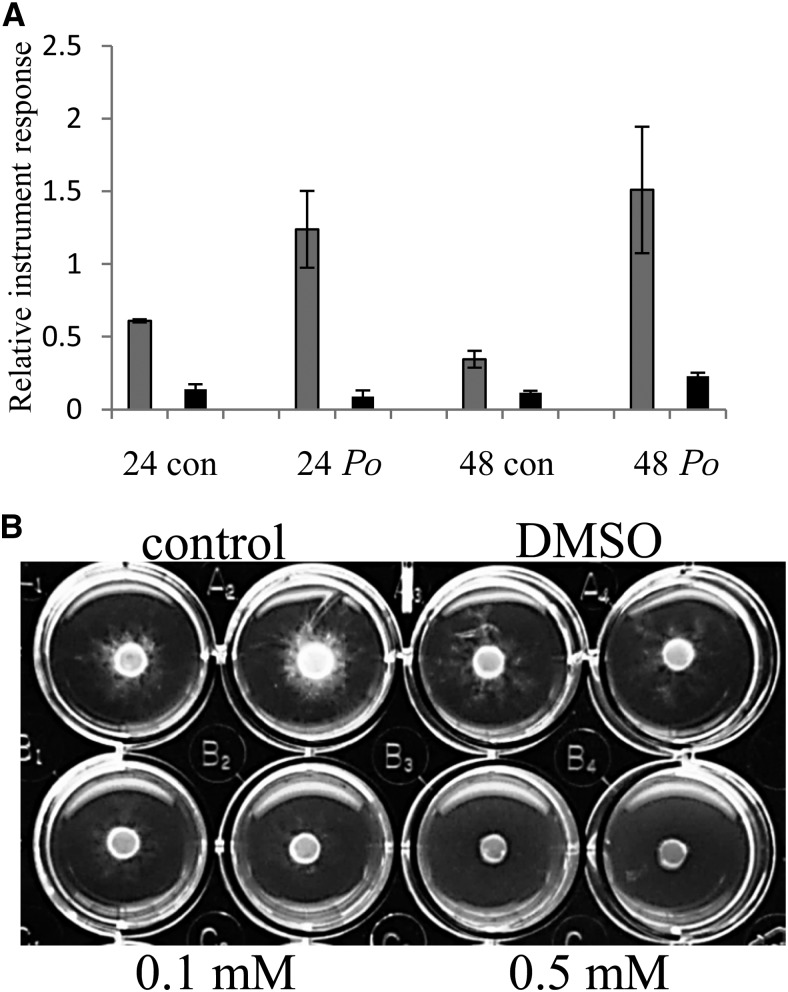
A, Relative abundance of DHF in water control (con) and cotton root rot (Po)-treated border cells (gray bars) and root tips (black bars) after 24 h (24) and 48 h (48) of exposure. n = 3 or 4, and error bars represent se. B, In vitro assay of antifungal activity after 5 d of no-treatment control, dimethyl sulfoxide (DMSO) only, and two concentrations of DHF against cotton root rot. Fungal growth was quantified on a scale of 0 to 5, with 0 meaning no growth and 5 meaning no inhibition: control and DMSO = 5, 0.1 mm = 1, and 0.5 mm = 0.

