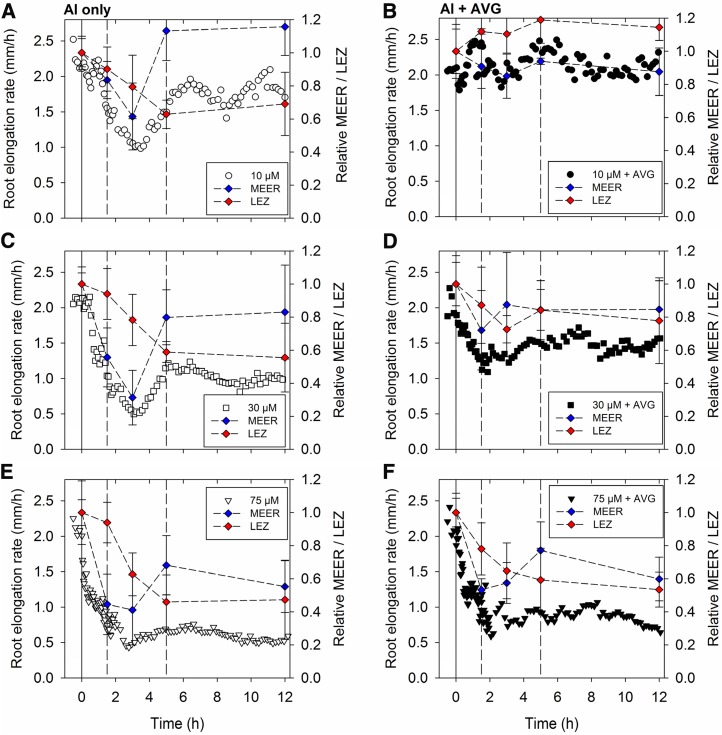
Figure 3.
RER in soybean seedlings exposed to 10, 30, or 75 µm Al either without (A, C, and E) or with (B, D, and F) AVG. For clarity, the sds (five replicates) are not shown for RER (Fig. 2). The dashed vertical lines are at times of 1.5 and 5 h, corresponding to different patterns of growth. The MEER (Supplemental Fig. S4) and the LEZ (Supplemental Figs. S2 and S3) have been plotted to help explain the changes in RER.

