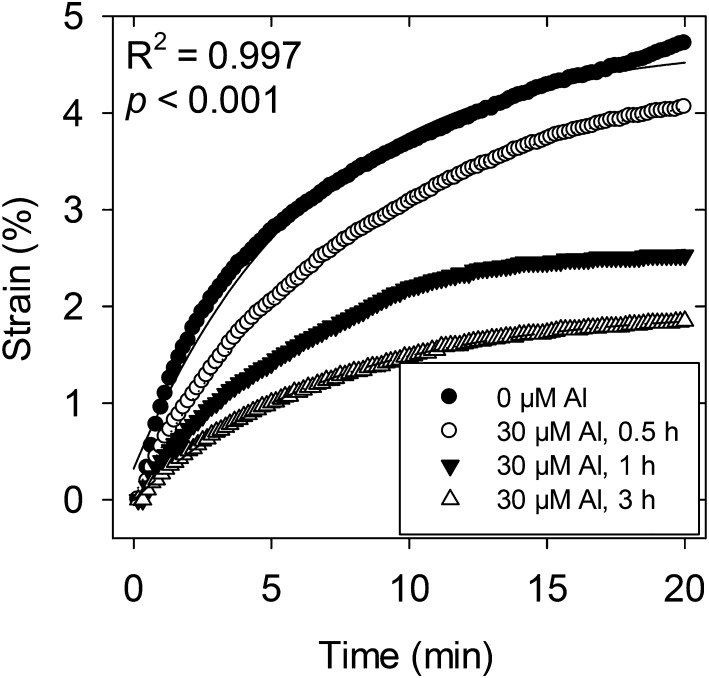
Figure 6.
Extension of cell walls in the elongation zone of soybean roots grown in solutions containing 30 µm Al for 0.5, 1, or 3 h compared with those grown in basal solution (control). Grouped regression analysis indicated significant differences between curves (P < 0.001). Each value is the arithmetic mean of three replicates.

